I created three visualizations of RNA-Seq data from the GTEx project (version 2013-03-21). They’re powered by JBrowse, the WashU Epigenome Browser, and canvasXpress.
(At some point, these links broke and I haven’t had time to fix them.)
JBrowse Genome Browser #
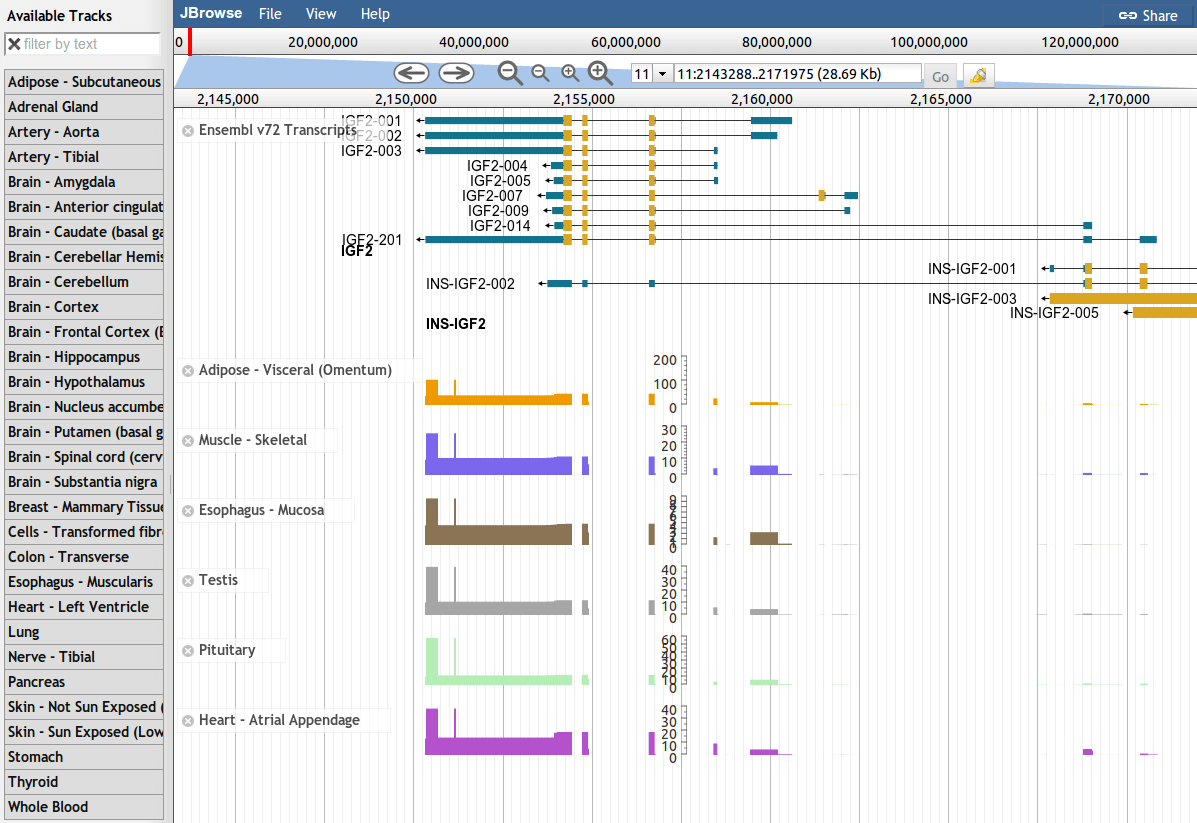
View expression of each coding nucleotide in the human genome (hg19).
A nucleotide’s expression level is the sum of Gencode v12 transcript RPKMs. The transcript levels were quantified by the GTEx team using Flux Capacitor. If you have RNA-Seq data, do not use Flux Capacitor. Instead, you should use RSEM or Cufflinks.
WashU Epigenome Browser #
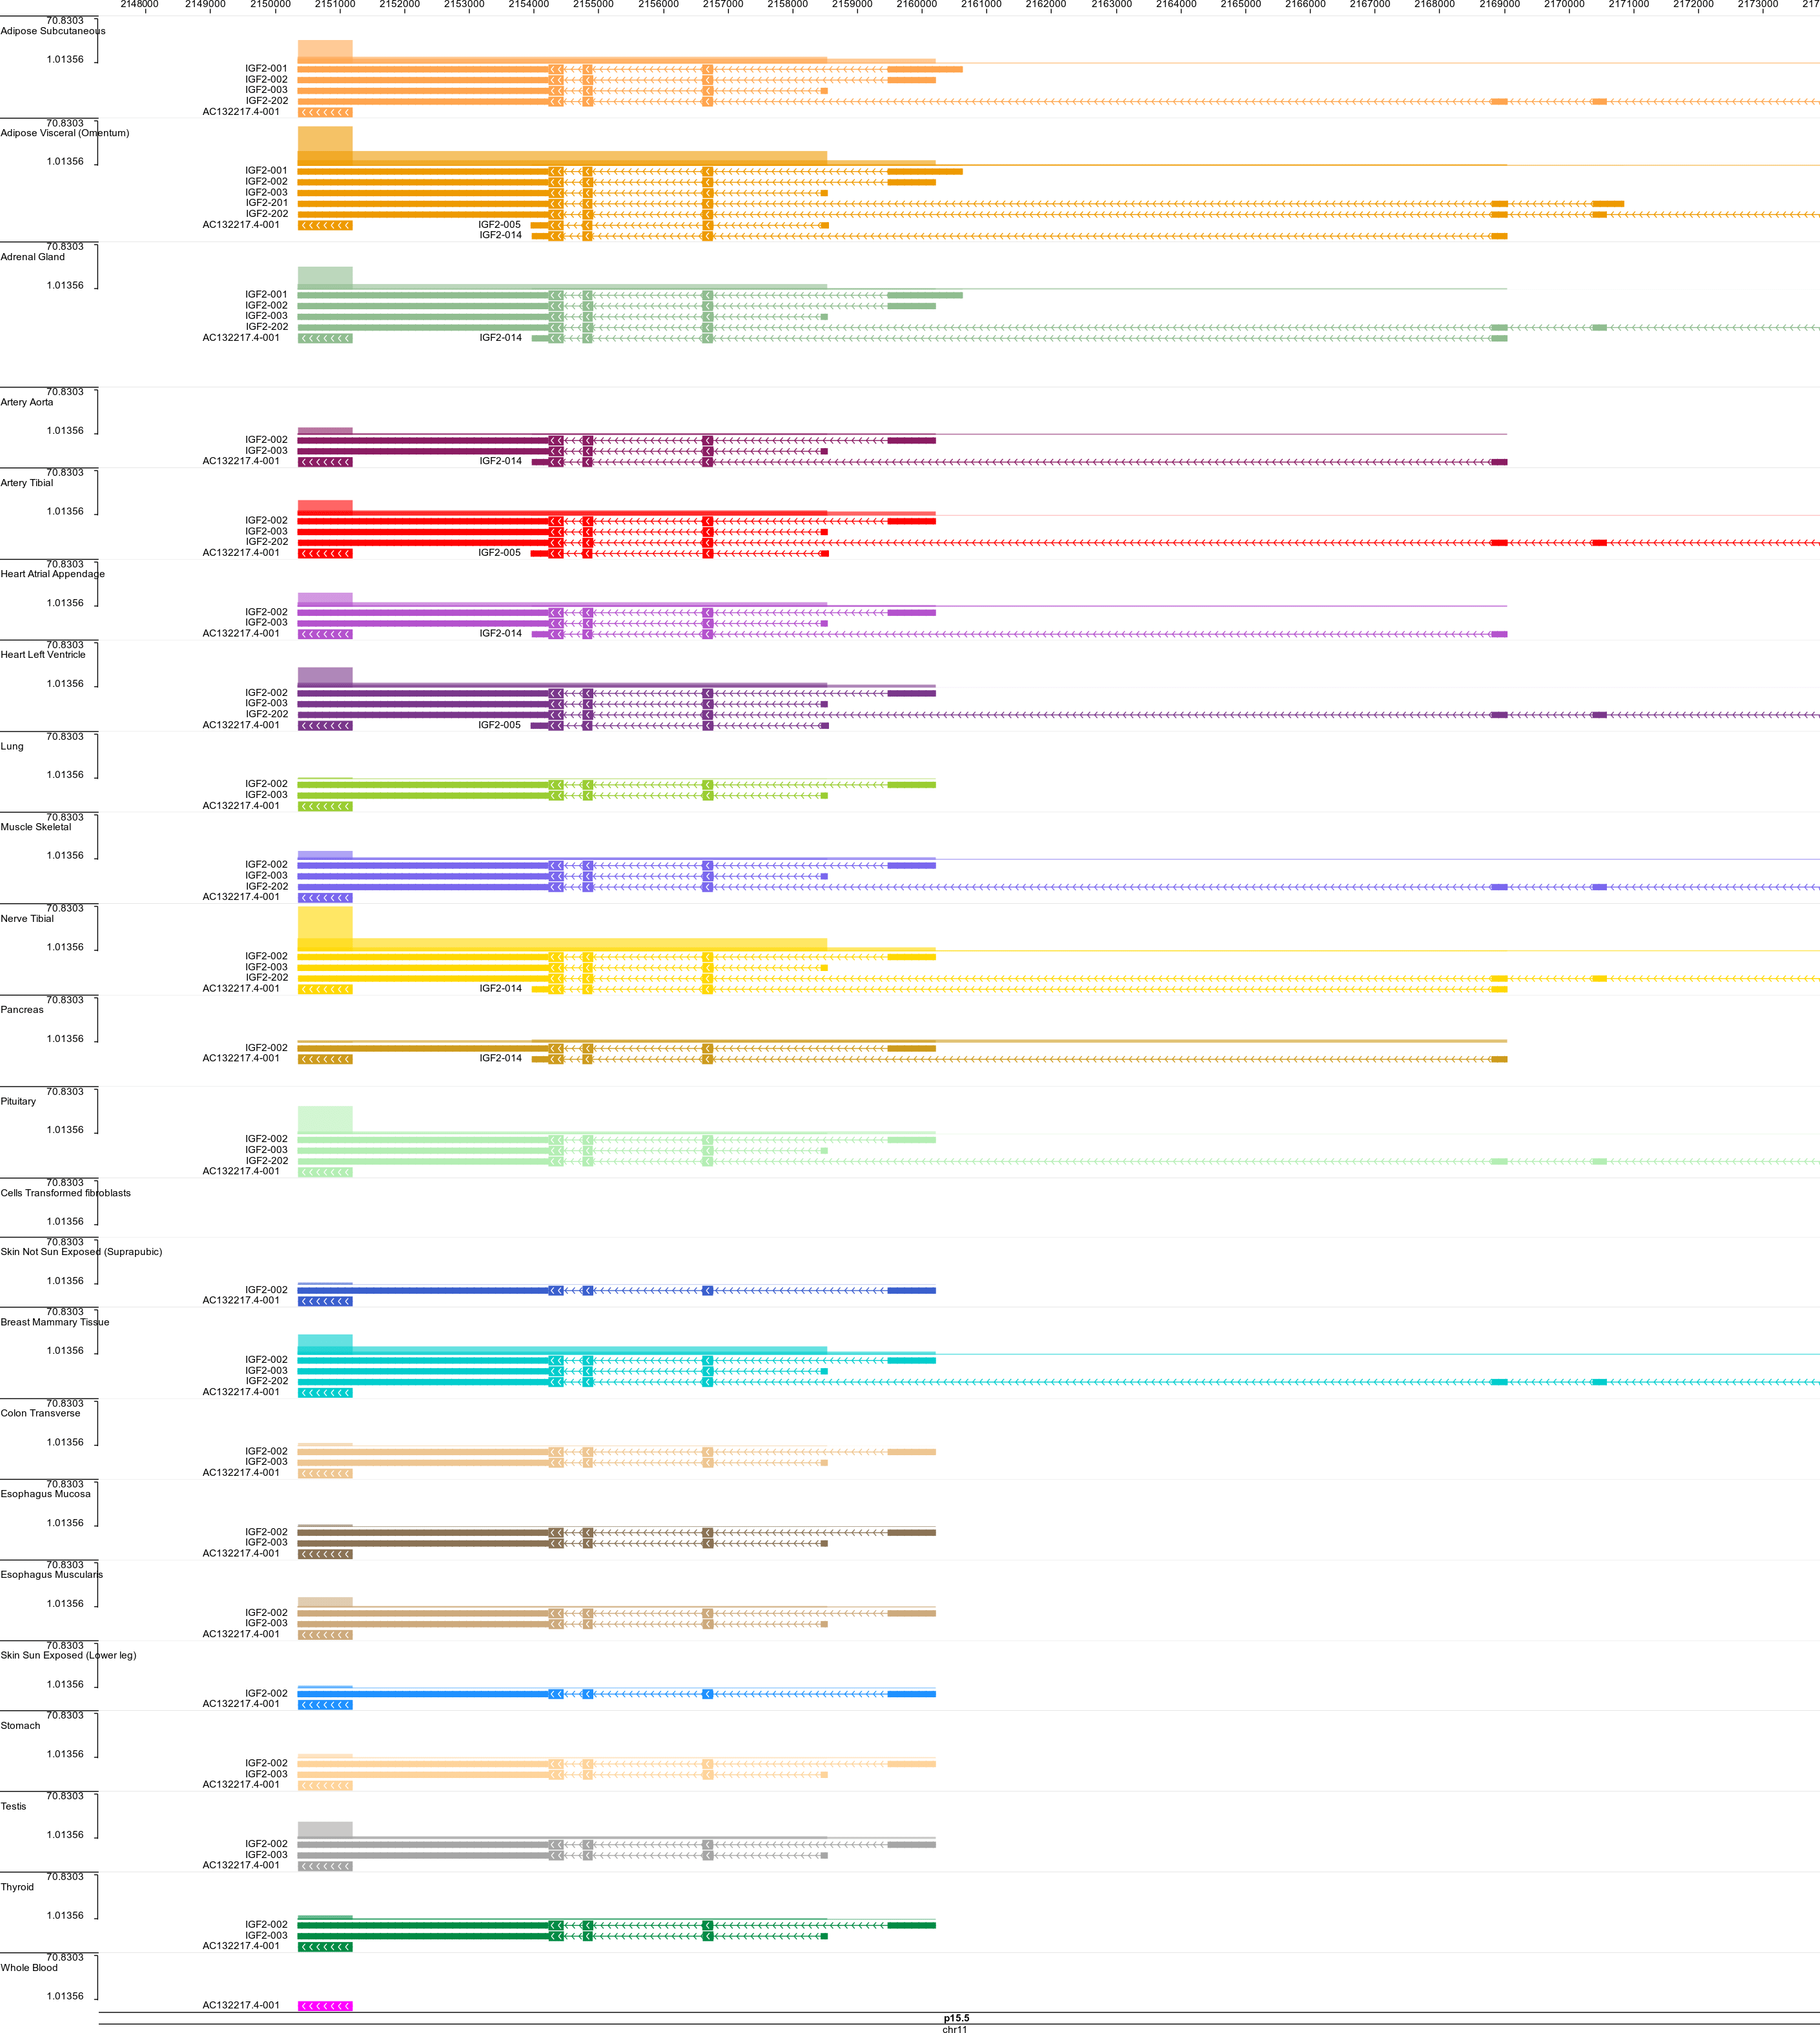
View the expression of Gencode v12 transcripts across 23 human tissues.
Heatmap #

View expression of all Gencode v12 transcripts for a chosen gene.
Reply by Email