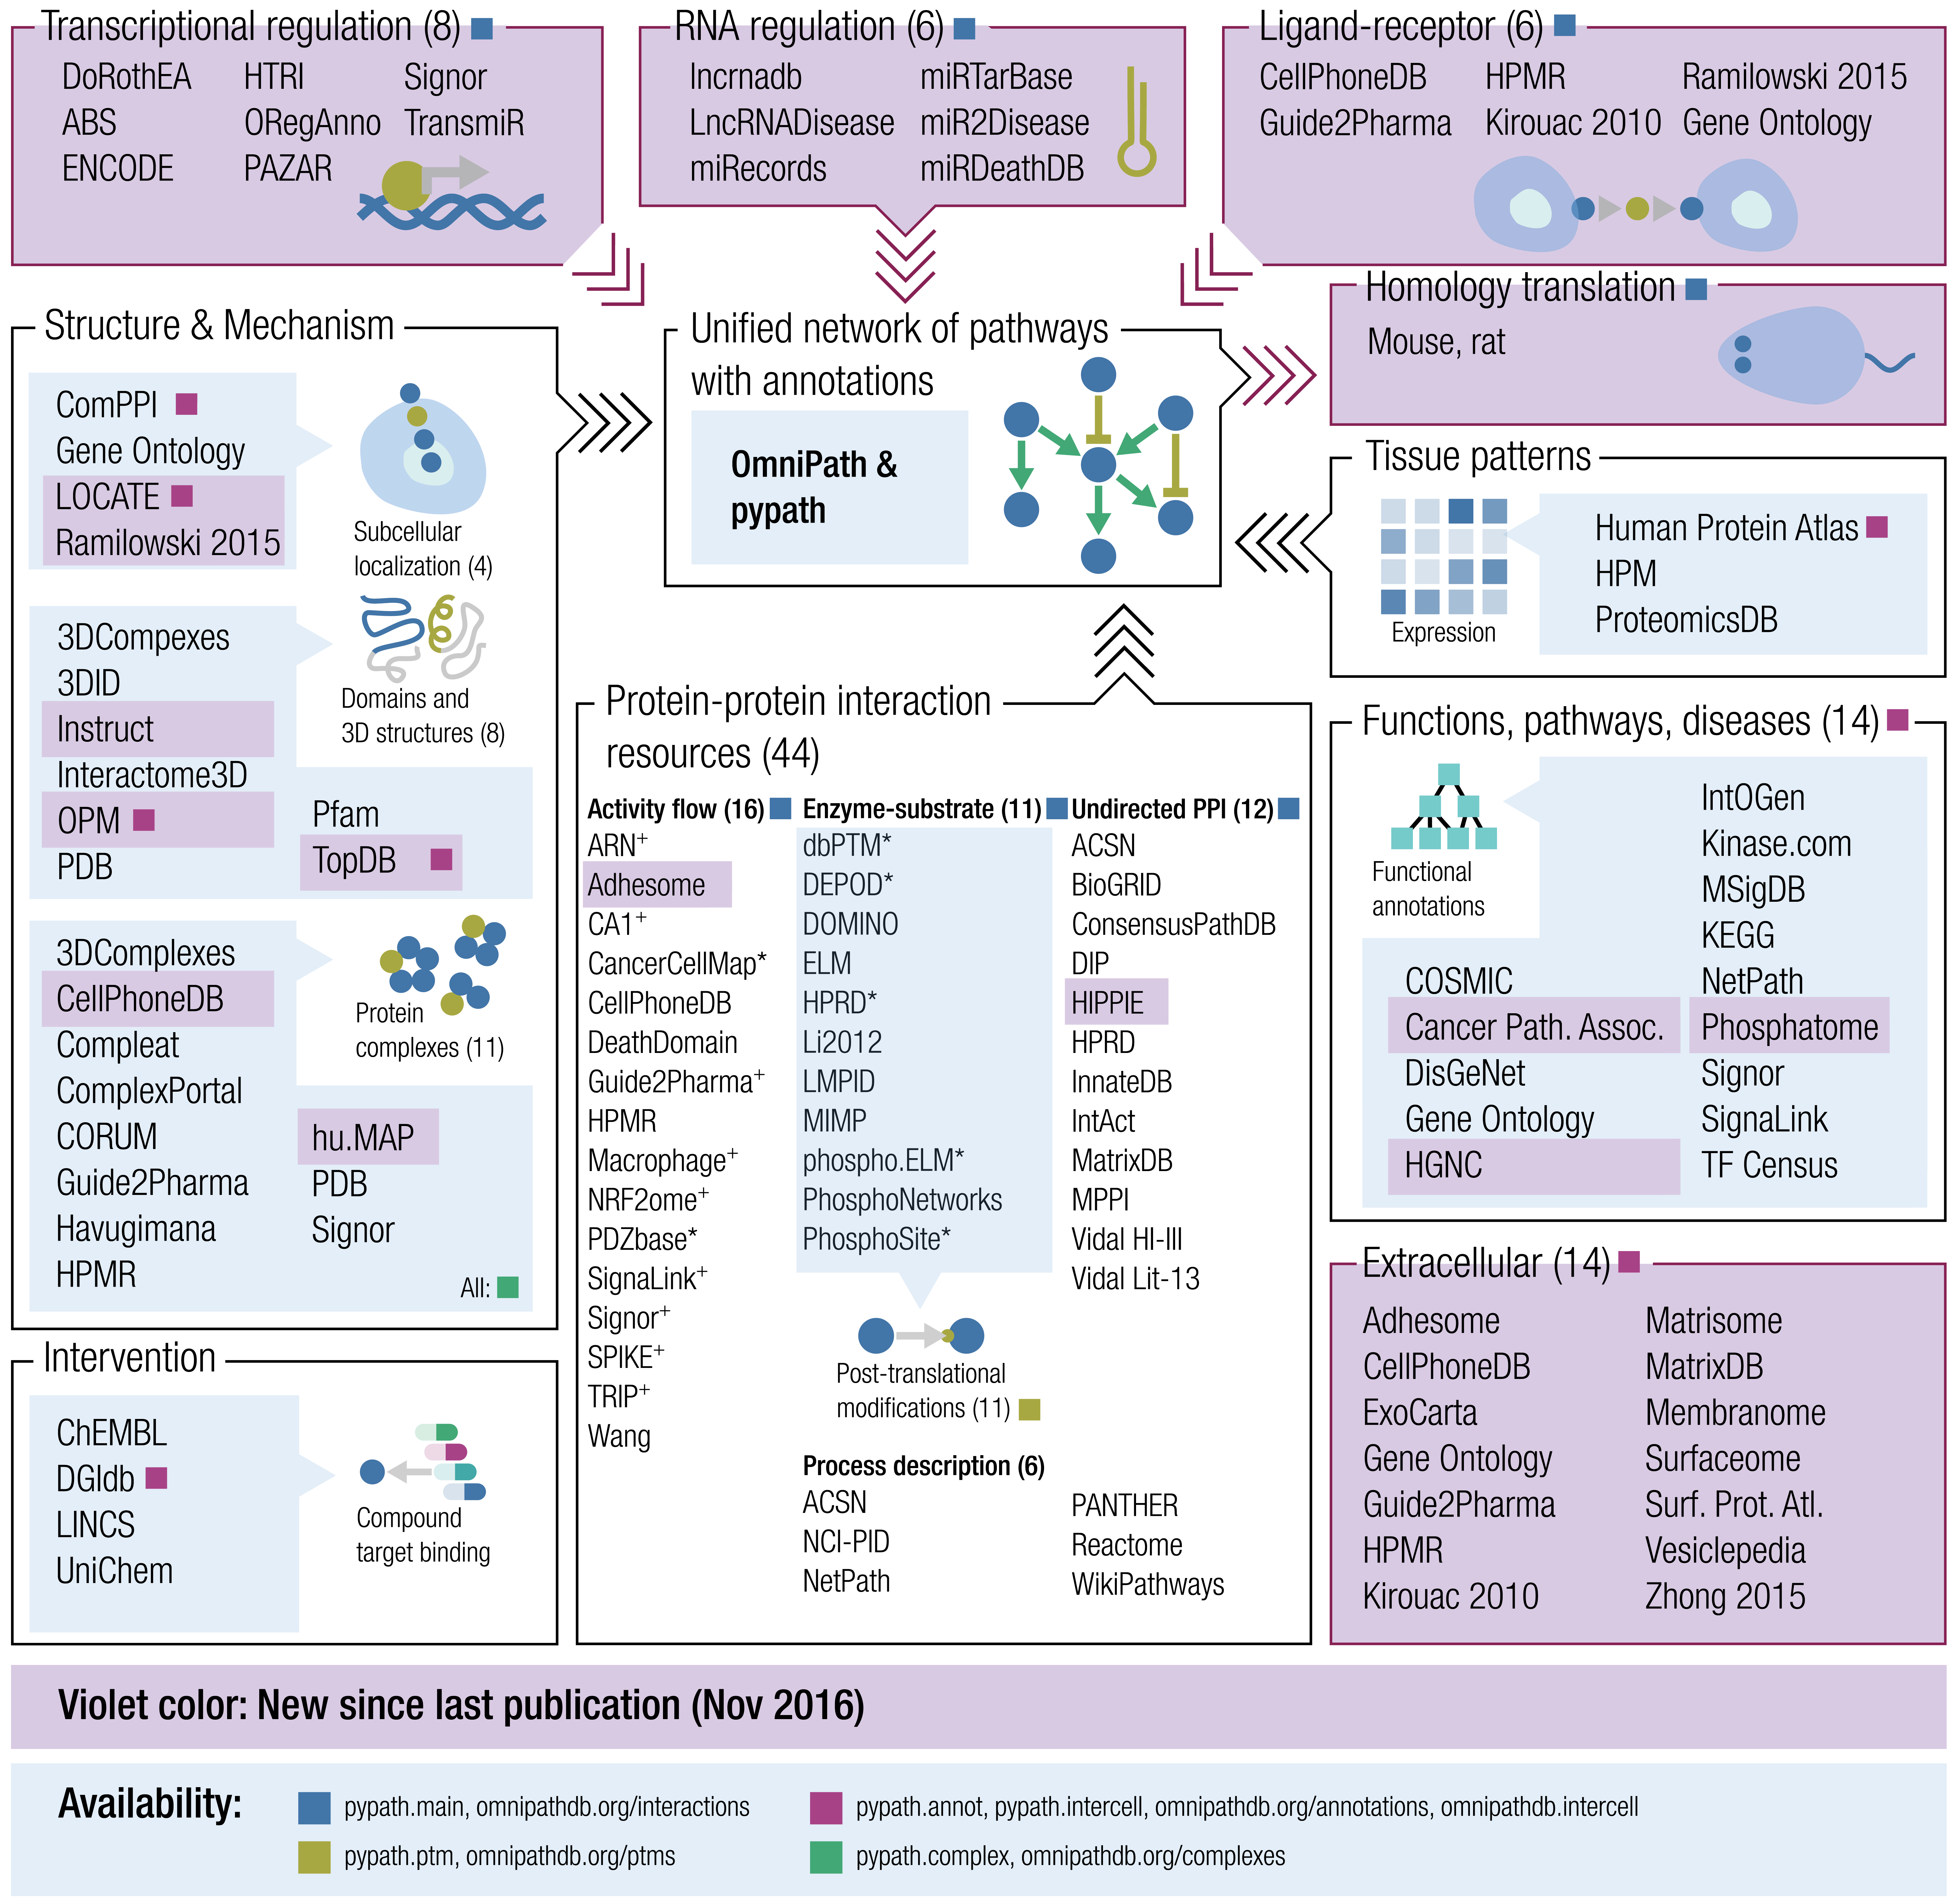
Curated lists of genes help computational biologists to focus analyses on a subset of genes that might be important for a research question. For example, we might be interested to focus on the genes encoding the signals and receptors for cell-to-cell communication. OmnipathR is a new R package that provides access to a vast database of genes called OmniPath, organized and curated by the Saez-Rodriguez Lab. Let’s try to use OmnipathR to create a simple table with ligands and receptors.
Install OmnipathR #
Let’s get the latest development version from GitHub. For me, that was 1.3.7 when I wrote this post.
devtools::install_github("saezlab/OmnipathR")
Make a table of ligands and receptors #
Load the package.
library(OmnipathR)
library(dplyr)
OmniPath has a lot of annotations and functions for accessing them.
Let’s try the import_intercell_network() function.
icn <- OmnipathR::import_intercell_network()
The returned icn object is a data frame with 30,265 rows and
44 columns. It’s a lot of information!
Download the table #
Download the entire table with 30,265 rows:
💾 omnipath-intercell-network.tsv (12.2 Mb)
Explore the first 100 records #
Lets have a look at the first 100 records:
| category_intercell_source | parent_intercell_source | source | target | category_intercell_target | parent_intercell_target | target_genesymbol | source_genesymbol | is_directed | is_stimulation | is_inhibition | consensus_direction | consensus_stimulation | consensus_inhibition | dip_url | sources | references | curation_effort | n_references | n_resources | database_intercell_source | scope_intercell_source | aspect_intercell_source | category_source_intercell_source | genesymbol_intercell_source | entity_type_intercell_source | consensus_score_intercell_source | transmitter_intercell_source | receiver_intercell_source | secreted_intercell_source | plasma_membrane_transmembrane_intercell_source | plasma_membrane_peripheral_intercell_source | database_intercell_target | scope_intercell_target | aspect_intercell_target | category_source_intercell_target | genesymbol_intercell_target | entity_type_intercell_target | consensus_score_intercell_target | transmitter_intercell_target | receiver_intercell_target | secreted_intercell_target | plasma_membrane_transmembrane_intercell_target | plasma_membrane_peripheral_intercell_target |
|---|---|---|---|---|---|---|---|---|---|---|---|---|---|---|---|---|---|---|---|---|---|---|---|---|---|---|---|---|---|---|---|---|---|---|---|---|---|---|---|---|---|---|---|
| adhesion | adhesion | A4D0S4 | O75578 | adhesion | adhesion | ITGA10 | LAMB4 | 1 | 1 | 0 | 1 | 1 | 0 | Wang | 0 | 0 | 1 | OmniPath | generic | functional | composite | LAMB4 | protein | 1 | TRUE | TRUE | TRUE | FALSE | FALSE | Adhesome;OmniPath | generic | functional | resource_specific | ITGA10 | protein | 2 | TRUE | TRUE | FALSE | TRUE | FALSE | ||
| adhesion | adhesion | A4D0S4 | O75578 | matrix_adhesion | matrix_adhesion | ITGA10 | LAMB4 | 1 | 1 | 0 | 1 | 1 | 0 | Wang | 0 | 0 | 1 | OmniPath | generic | functional | composite | LAMB4 | protein | 1 | TRUE | TRUE | TRUE | FALSE | FALSE | Zhong2015;OmniPath | generic | functional | resource_specific | ITGA10 | protein | 1 | FALSE | TRUE | FALSE | TRUE | FALSE | ||
| adhesion | adhesion | A4D0S4 | O75578 | receptor | receptor | ITGA10 | LAMB4 | 1 | 1 | 0 | 1 | 1 | 0 | Wang | 0 | 0 | 1 | OmniPath | generic | functional | composite | LAMB4 | protein | 1 | TRUE | TRUE | TRUE | FALSE | FALSE | iTALK;Almen2009;CellCellInteractions;CellPhoneDB;HPMR;Surfaceome;Ramilowski2015;LRdb;OmniPath | generic | functional | resource_specific | ITGA10 | protein | 8 | FALSE | TRUE | FALSE | TRUE | FALSE | ||
| adhesion | adhesion | A4D0S4 | P05106 | adhesion | adhesion | ITGB3 | LAMB4 | 1 | 1 | 0 | 1 | 1 | 0 | Wang | 0 | 0 | 1 | OmniPath | generic | functional | composite | LAMB4 | protein | 1 | TRUE | TRUE | TRUE | FALSE | FALSE | Adhesome;OmniPath | generic | functional | resource_specific | ITGB3 | protein | 2 | TRUE | TRUE | FALSE | TRUE | FALSE | ||
| adhesion | adhesion | A4D0S4 | P05106 | matrix_adhesion | matrix_adhesion | ITGB3 | LAMB4 | 1 | 1 | 0 | 1 | 1 | 0 | Wang | 0 | 0 | 1 | OmniPath | generic | functional | composite | LAMB4 | protein | 1 | TRUE | TRUE | TRUE | FALSE | FALSE | Zhong2015;OmniPath | generic | functional | resource_specific | ITGB3 | protein | 1 | FALSE | TRUE | FALSE | TRUE | FALSE | ||
| adhesion | adhesion | A4D0S4 | P05106 | receptor | receptor | ITGB3 | LAMB4 | 1 | 1 | 0 | 1 | 1 | 0 | Wang | 0 | 0 | 1 | OmniPath | generic | functional | composite | LAMB4 | protein | 1 | TRUE | TRUE | TRUE | FALSE | FALSE | iTALK;Almen2009;CellCellInteractions;EMBRACE;CellPhoneDB;GO_Intercell;HPMR;Surfaceome;Ramilowski2015;LRdb;Baccin2019;OmniPath | generic | functional | resource_specific | ITGB3 | protein | 11 | FALSE | TRUE | FALSE | TRUE | FALSE | ||
| adhesion | adhesion | A4D0S4 | P05556 | adhesion | adhesion | ITGB1 | LAMB4 | 1 | 1 | 0 | 1 | 1 | 0 | Wang | 0 | 0 | 1 | OmniPath | generic | functional | composite | LAMB4 | protein | 1 | TRUE | TRUE | TRUE | FALSE | FALSE | Adhesome;OmniPath | generic | functional | resource_specific | ITGB1 | protein | 2 | TRUE | TRUE | FALSE | TRUE | FALSE | ||
| adhesion | adhesion | A4D0S4 | P05556 | matrix_adhesion | matrix_adhesion | ITGB1 | LAMB4 | 1 | 1 | 0 | 1 | 1 | 0 | Wang | 0 | 0 | 1 | OmniPath | generic | functional | composite | LAMB4 | protein | 1 | TRUE | TRUE | TRUE | FALSE | FALSE | Zhong2015;OmniPath | generic | functional | resource_specific | ITGB1 | protein | 1 | FALSE | TRUE | FALSE | TRUE | FALSE | ||
| adhesion | adhesion | A4D0S4 | P05556 | receptor | receptor | ITGB1 | LAMB4 | 1 | 1 | 0 | 1 | 1 | 0 | Wang | 0 | 0 | 1 | OmniPath | generic | functional | composite | LAMB4 | protein | 1 | TRUE | TRUE | TRUE | FALSE | FALSE | iTALK;Almen2009;CellCellInteractions;EMBRACE;CellPhoneDB;GO_Intercell;HPMR;ICELLNET;Surfaceome;Ramilowski2015;Kirouac2010;LRdb;Baccin2019;OmniPath | generic | functional | resource_specific | ITGB1 | protein | 13 | FALSE | TRUE | FALSE | TRUE | FALSE | ||
| adhesion | adhesion | A4D0S4 | P06756 | adhesion | adhesion | ITGAV | LAMB4 | 1 | 1 | 0 | 1 | 1 | 0 | Wang | 0 | 0 | 1 | OmniPath | generic | functional | composite | LAMB4 | protein | 1 | TRUE | TRUE | TRUE | FALSE | FALSE | Adhesome;OmniPath | generic | functional | resource_specific | ITGAV | protein | 2 | TRUE | TRUE | FALSE | TRUE | FALSE | ||
| adhesion | adhesion | A4D0S4 | P06756 | matrix_adhesion | matrix_adhesion | ITGAV | LAMB4 | 1 | 1 | 0 | 1 | 1 | 0 | Wang | 0 | 0 | 1 | OmniPath | generic | functional | composite | LAMB4 | protein | 1 | TRUE | TRUE | TRUE | FALSE | FALSE | Zhong2015;OmniPath | generic | functional | resource_specific | ITGAV | protein | 1 | FALSE | TRUE | FALSE | TRUE | FALSE | ||
| adhesion | adhesion | A4D0S4 | P06756 | receptor | receptor | ITGAV | LAMB4 | 1 | 1 | 0 | 1 | 1 | 0 | Wang | 0 | 0 | 1 | OmniPath | generic | functional | composite | LAMB4 | protein | 1 | TRUE | TRUE | TRUE | FALSE | FALSE | iTALK;Almen2009;CellCellInteractions;EMBRACE;CellPhoneDB;GO_Intercell;HPMR;ICELLNET;Surfaceome;Ramilowski2015;LRdb;OmniPath | generic | functional | resource_specific | ITGAV | protein | 11 | FALSE | TRUE | FALSE | TRUE | FALSE | ||
| adhesion | adhesion | A4D0S4 | P08514 | adhesion | adhesion | ITGA2B | LAMB4 | 1 | 1 | 0 | 1 | 1 | 0 | Wang | 0 | 0 | 1 | OmniPath | generic | functional | composite | LAMB4 | protein | 1 | TRUE | TRUE | TRUE | FALSE | FALSE | OmniPath | generic | functional | composite | ITGA2B | protein | 1 | TRUE | TRUE | FALSE | TRUE | FALSE | ||
| adhesion | adhesion | A4D0S4 | P08514 | matrix_adhesion | matrix_adhesion | ITGA2B | LAMB4 | 1 | 1 | 0 | 1 | 1 | 0 | Wang | 0 | 0 | 1 | OmniPath | generic | functional | composite | LAMB4 | protein | 1 | TRUE | TRUE | TRUE | FALSE | FALSE | Zhong2015;OmniPath | generic | functional | resource_specific | ITGA2B | protein | 1 | FALSE | TRUE | FALSE | TRUE | FALSE | ||
| adhesion | adhesion | A4D0S4 | P08514 | receptor | receptor | ITGA2B | LAMB4 | 1 | 1 | 0 | 1 | 1 | 0 | Wang | 0 | 0 | 1 | OmniPath | generic | functional | composite | LAMB4 | protein | 1 | TRUE | TRUE | TRUE | FALSE | FALSE | iTALK;Almen2009;CellCellInteractions;EMBRACE;CellPhoneDB;GO_Intercell;HPMR;Surfaceome;Ramilowski2015;LRdb;OmniPath | generic | functional | resource_specific | ITGA2B | protein | 10 | FALSE | TRUE | FALSE | TRUE | FALSE | ||
| adhesion | adhesion | A4D0S4 | P08648 | adhesion | adhesion | ITGA5 | LAMB4 | 1 | 1 | 0 | 1 | 1 | 0 | Wang | 0 | 0 | 1 | OmniPath | generic | functional | composite | LAMB4 | protein | 1 | TRUE | TRUE | TRUE | FALSE | FALSE | Adhesome;OmniPath | generic | functional | resource_specific | ITGA5 | protein | 2 | TRUE | TRUE | FALSE | TRUE | FALSE | ||
| adhesion | adhesion | A4D0S4 | P08648 | matrix_adhesion | matrix_adhesion | ITGA5 | LAMB4 | 1 | 1 | 0 | 1 | 1 | 0 | Wang | 0 | 0 | 1 | OmniPath | generic | functional | composite | LAMB4 | protein | 1 | TRUE | TRUE | TRUE | FALSE | FALSE | Zhong2015;OmniPath | generic | functional | resource_specific | ITGA5 | protein | 1 | FALSE | TRUE | FALSE | TRUE | FALSE | ||
| adhesion | adhesion | A4D0S4 | P08648 | receptor | receptor | ITGA5 | LAMB4 | 1 | 1 | 0 | 1 | 1 | 0 | Wang | 0 | 0 | 1 | OmniPath | generic | functional | composite | LAMB4 | protein | 1 | TRUE | TRUE | TRUE | FALSE | FALSE | iTALK;Almen2009;CellCellInteractions;EMBRACE;CellPhoneDB;GO_Intercell;HPMR;Surfaceome;Ramilowski2015;LRdb;OmniPath | generic | functional | resource_specific | ITGA5 | protein | 10 | FALSE | TRUE | FALSE | TRUE | FALSE | ||
| adhesion | adhesion | A4D0S4 | P13612 | adhesion | adhesion | ITGA4 | LAMB4 | 1 | 1 | 0 | 1 | 1 | 0 | Wang | 0 | 0 | 1 | OmniPath | generic | functional | composite | LAMB4 | protein | 1 | TRUE | TRUE | TRUE | FALSE | FALSE | MCAM;Adhesome;OmniPath | generic | functional | resource_specific | ITGA4 | protein | 3 | TRUE | TRUE | FALSE | TRUE | FALSE | ||
| adhesion | adhesion | A4D0S4 | P13612 | matrix_adhesion | matrix_adhesion | ITGA4 | LAMB4 | 1 | 1 | 0 | 1 | 1 | 0 | Wang | 0 | 0 | 1 | OmniPath | generic | functional | composite | LAMB4 | protein | 1 | TRUE | TRUE | TRUE | FALSE | FALSE | Zhong2015;OmniPath | generic | functional | resource_specific | ITGA4 | protein | 1 | FALSE | TRUE | FALSE | TRUE | FALSE | ||
| adhesion | adhesion | A4D0S4 | P13612 | receptor | receptor | ITGA4 | LAMB4 | 1 | 1 | 0 | 1 | 1 | 0 | Wang | 0 | 0 | 1 | OmniPath | generic | functional | composite | LAMB4 | protein | 1 | TRUE | TRUE | TRUE | FALSE | FALSE | iTALK;CellCellInteractions;EMBRACE;CellPhoneDB;GO_Intercell;HPMR;Surfaceome;Ramilowski2015;LRdb;OmniPath | generic | functional | resource_specific | ITGA4 | protein | 9 | FALSE | TRUE | FALSE | TRUE | FALSE | ||
| adhesion | adhesion | A4D0S4 | P16070 | adhesion | adhesion | CD44 | LAMB4 | 1 | 1 | 0 | 1 | 1 | 0 | Wang | 0 | 0 | 1 | OmniPath | generic | functional | composite | LAMB4 | protein | 1 | TRUE | TRUE | TRUE | FALSE | FALSE | OmniPath | generic | functional | composite | CD44 | protein | 1 | TRUE | TRUE | TRUE | TRUE | FALSE | ||
| adhesion | adhesion | A4D0S4 | P16070 | cell_adhesion | cell_adhesion | CD44 | LAMB4 | 1 | 1 | 0 | 1 | 1 | 0 | Wang | 0 | 0 | 1 | OmniPath | generic | functional | composite | LAMB4 | protein | 1 | TRUE | TRUE | TRUE | FALSE | FALSE | OmniPath | generic | functional | composite | CD44 | protein | 0 | TRUE | TRUE | TRUE | TRUE | FALSE | ||
| adhesion | adhesion | A4D0S4 | P16070 | matrix_adhesion | matrix_adhesion | CD44 | LAMB4 | 1 | 1 | 0 | 1 | 1 | 0 | Wang | 0 | 0 | 1 | OmniPath | generic | functional | composite | LAMB4 | protein | 1 | TRUE | TRUE | TRUE | FALSE | FALSE | Zhong2015;OmniPath | generic | functional | resource_specific | CD44 | protein | 1 | FALSE | TRUE | TRUE | TRUE | FALSE | ||
| adhesion | adhesion | A4D0S4 | P16070 | receptor | receptor | CD44 | LAMB4 | 1 | 1 | 0 | 1 | 1 | 0 | Wang | 0 | 0 | 1 | OmniPath | generic | functional | composite | LAMB4 | protein | 1 | TRUE | TRUE | TRUE | FALSE | FALSE | iTALK;CellCellInteractions;EMBRACE;CellPhoneDB;GO_Intercell;HPMR;ICELLNET;Ramilowski2015;LRdb;Baccin2019;OmniPath | generic | functional | resource_specific | CD44 | protein | 10 | FALSE | TRUE | TRUE | TRUE | FALSE | ||
| adhesion | adhesion | A4D0S4 | P17301 | adhesion | adhesion | ITGA2 | LAMB4 | 1 | 1 | 0 | 1 | 1 | 0 | Wang | 0 | 0 | 1 | OmniPath | generic | functional | composite | LAMB4 | protein | 1 | TRUE | TRUE | TRUE | FALSE | FALSE | Adhesome;OmniPath | generic | functional | resource_specific | ITGA2 | protein | 2 | TRUE | TRUE | FALSE | TRUE | FALSE | ||
| adhesion | adhesion | A4D0S4 | P17301 | matrix_adhesion | matrix_adhesion | ITGA2 | LAMB4 | 1 | 1 | 0 | 1 | 1 | 0 | Wang | 0 | 0 | 1 | OmniPath | generic | functional | composite | LAMB4 | protein | 1 | TRUE | TRUE | TRUE | FALSE | FALSE | Zhong2015;OmniPath | generic | functional | resource_specific | ITGA2 | protein | 1 | FALSE | TRUE | FALSE | TRUE | FALSE | ||
| adhesion | adhesion | A4D0S4 | P17301 | receptor | receptor | ITGA2 | LAMB4 | 1 | 1 | 0 | 1 | 1 | 0 | Wang | 0 | 0 | 1 | OmniPath | generic | functional | composite | LAMB4 | protein | 1 | TRUE | TRUE | TRUE | FALSE | FALSE | iTALK;Almen2009;CellCellInteractions;EMBRACE;CellPhoneDB;GO_Intercell;Surfaceome;Ramilowski2015;LRdb;OmniPath | generic | functional | resource_specific | ITGA2 | protein | 9 | FALSE | TRUE | FALSE | TRUE | FALSE | ||
| adhesion | adhesion | A4D0S4 | P18084 | adhesion | adhesion | ITGB5 | LAMB4 | 1 | 1 | 0 | 1 | 1 | 0 | Wang | 0 | 0 | 1 | OmniPath | generic | functional | composite | LAMB4 | protein | 1 | TRUE | TRUE | TRUE | FALSE | FALSE | Adhesome;OmniPath | generic | functional | resource_specific | ITGB5 | protein | 2 | TRUE | TRUE | FALSE | TRUE | FALSE | ||
| adhesion | adhesion | A4D0S4 | P18084 | matrix_adhesion | matrix_adhesion | ITGB5 | LAMB4 | 1 | 1 | 0 | 1 | 1 | 0 | Wang | 0 | 0 | 1 | OmniPath | generic | functional | composite | LAMB4 | protein | 1 | TRUE | TRUE | TRUE | FALSE | FALSE | Zhong2015;OmniPath | generic | functional | resource_specific | ITGB5 | protein | 1 | FALSE | TRUE | FALSE | TRUE | FALSE | ||
| adhesion | adhesion | A4D0S4 | P18084 | receptor | receptor | ITGB5 | LAMB4 | 1 | 1 | 0 | 1 | 1 | 0 | Wang | 0 | 0 | 1 | OmniPath | generic | functional | composite | LAMB4 | protein | 1 | TRUE | TRUE | TRUE | FALSE | FALSE | iTALK;CellCellInteractions;EMBRACE;CellPhoneDB;GO_Intercell;HPMR;Surfaceome;Ramilowski2015;LRdb;OmniPath | generic | functional | resource_specific | ITGB5 | protein | 9 | FALSE | TRUE | FALSE | TRUE | FALSE | ||
| adhesion | adhesion | A4D0S4 | P18564 | adhesion | adhesion | ITGB6 | LAMB4 | 1 | 1 | 0 | 1 | 1 | 0 | Wang | 0 | 0 | 1 | OmniPath | generic | functional | composite | LAMB4 | protein | 1 | TRUE | TRUE | TRUE | FALSE | FALSE | Adhesome;OmniPath | generic | functional | resource_specific | ITGB6 | protein | 2 | TRUE | TRUE | FALSE | TRUE | FALSE | ||
| adhesion | adhesion | A4D0S4 | P18564 | matrix_adhesion | matrix_adhesion | ITGB6 | LAMB4 | 1 | 1 | 0 | 1 | 1 | 0 | Wang | 0 | 0 | 1 | OmniPath | generic | functional | composite | LAMB4 | protein | 1 | TRUE | TRUE | TRUE | FALSE | FALSE | Zhong2015;OmniPath | generic | functional | resource_specific | ITGB6 | protein | 1 | FALSE | TRUE | FALSE | TRUE | FALSE | ||
| adhesion | adhesion | A4D0S4 | P18564 | receptor | receptor | ITGB6 | LAMB4 | 1 | 1 | 0 | 1 | 1 | 0 | Wang | 0 | 0 | 1 | OmniPath | generic | functional | composite | LAMB4 | protein | 1 | TRUE | TRUE | TRUE | FALSE | FALSE | iTALK;Almen2009;CellCellInteractions;CellPhoneDB;GO_Intercell;HPMR;Surfaceome;Ramilowski2015;LRdb;OmniPath | generic | functional | resource_specific | ITGB6 | protein | 9 | FALSE | TRUE | FALSE | TRUE | FALSE | ||
| adhesion | adhesion | A4D0S4 | P26006 | adhesion | adhesion | ITGA3 | LAMB4 | 1 | 1 | 0 | 1 | 1 | 0 | Wang | 0 | 0 | 1 | OmniPath | generic | functional | composite | LAMB4 | protein | 1 | TRUE | TRUE | TRUE | FALSE | FALSE | Adhesome;OmniPath | generic | functional | resource_specific | ITGA3 | protein | 2 | TRUE | TRUE | FALSE | TRUE | FALSE | ||
| adhesion | adhesion | A4D0S4 | P26006 | matrix_adhesion | matrix_adhesion | ITGA3 | LAMB4 | 1 | 1 | 0 | 1 | 1 | 0 | Wang | 0 | 0 | 1 | OmniPath | generic | functional | composite | LAMB4 | protein | 1 | TRUE | TRUE | TRUE | FALSE | FALSE | Zhong2015;OmniPath | generic | functional | resource_specific | ITGA3 | protein | 1 | FALSE | TRUE | FALSE | TRUE | FALSE | ||
| adhesion | adhesion | A4D0S4 | P26006 | receptor | receptor | ITGA3 | LAMB4 | 1 | 1 | 0 | 1 | 1 | 0 | Wang | 0 | 0 | 1 | OmniPath | generic | functional | composite | LAMB4 | protein | 1 | TRUE | TRUE | TRUE | FALSE | FALSE | iTALK;Almen2009;CellCellInteractions;EMBRACE;CellPhoneDB;GO_Intercell;HPMR;Surfaceome;Ramilowski2015;LRdb;OmniPath | generic | functional | resource_specific | ITGA3 | protein | 10 | FALSE | TRUE | FALSE | TRUE | FALSE | ||
| adhesion | adhesion | A4D0S4 | P26010 | adhesion | adhesion | ITGB7 | LAMB4 | 1 | 1 | 0 | 1 | 1 | 0 | Wang | 0 | 0 | 1 | OmniPath | generic | functional | composite | LAMB4 | protein | 1 | TRUE | TRUE | TRUE | FALSE | FALSE | Adhesome;OmniPath | generic | functional | resource_specific | ITGB7 | protein | 2 | TRUE | TRUE | FALSE | TRUE | FALSE | ||
| adhesion | adhesion | A4D0S4 | P26010 | cell_adhesion | cell_adhesion | ITGB7 | LAMB4 | 1 | 1 | 0 | 1 | 1 | 0 | Wang | 0 | 0 | 1 | OmniPath | generic | functional | composite | LAMB4 | protein | 1 | TRUE | TRUE | TRUE | FALSE | FALSE | OmniPath | generic | functional | composite | ITGB7 | protein | 0 | TRUE | TRUE | FALSE | TRUE | FALSE | ||
| adhesion | adhesion | A4D0S4 | P26010 | matrix_adhesion | matrix_adhesion | ITGB7 | LAMB4 | 1 | 1 | 0 | 1 | 1 | 0 | Wang | 0 | 0 | 1 | OmniPath | generic | functional | composite | LAMB4 | protein | 1 | TRUE | TRUE | TRUE | FALSE | FALSE | Zhong2015;OmniPath | generic | functional | resource_specific | ITGB7 | protein | 1 | FALSE | TRUE | FALSE | TRUE | FALSE | ||
| adhesion | adhesion | A4D0S4 | P26010 | receptor | receptor | ITGB7 | LAMB4 | 1 | 1 | 0 | 1 | 1 | 0 | Wang | 0 | 0 | 1 | OmniPath | generic | functional | composite | LAMB4 | protein | 1 | TRUE | TRUE | TRUE | FALSE | FALSE | iTALK;Almen2009;CellCellInteractions;EMBRACE;CellPhoneDB;GO_Intercell;HPMR;Surfaceome;Ramilowski2015;LRdb;OmniPath | generic | functional | resource_specific | ITGB7 | protein | 10 | FALSE | TRUE | FALSE | TRUE | FALSE | ||
| adhesion | adhesion | A4D0S4 | P26012 | adhesion | adhesion | ITGB8 | LAMB4 | 1 | 1 | 0 | 1 | 1 | 0 | Wang | 0 | 0 | 1 | OmniPath | generic | functional | composite | LAMB4 | protein | 1 | TRUE | TRUE | TRUE | FALSE | FALSE | Adhesome;OmniPath | generic | functional | resource_specific | ITGB8 | protein | 2 | TRUE | TRUE | FALSE | TRUE | FALSE | ||
| adhesion | adhesion | A4D0S4 | P26012 | matrix_adhesion | matrix_adhesion | ITGB8 | LAMB4 | 1 | 1 | 0 | 1 | 1 | 0 | Wang | 0 | 0 | 1 | OmniPath | generic | functional | composite | LAMB4 | protein | 1 | TRUE | TRUE | TRUE | FALSE | FALSE | Zhong2015;OmniPath | generic | functional | resource_specific | ITGB8 | protein | 1 | FALSE | TRUE | FALSE | TRUE | FALSE | ||
| adhesion | adhesion | A4D0S4 | P26012 | receptor | receptor | ITGB8 | LAMB4 | 1 | 1 | 0 | 1 | 1 | 0 | Wang | 0 | 0 | 1 | OmniPath | generic | functional | composite | LAMB4 | protein | 1 | TRUE | TRUE | TRUE | FALSE | FALSE | iTALK;Almen2009;CellCellInteractions;EMBRACE;GO_Intercell;HPMR;Surfaceome;Ramilowski2015;LRdb;OmniPath | generic | functional | resource_specific | ITGB8 | protein | 9 | FALSE | TRUE | FALSE | TRUE | FALSE | ||
| adhesion | adhesion | A4D0S4 | P53708 | adhesion | adhesion | ITGA8 | LAMB4 | 1 | 1 | 0 | 1 | 1 | 0 | Wang | 0 | 0 | 1 | OmniPath | generic | functional | composite | LAMB4 | protein | 1 | TRUE | TRUE | TRUE | FALSE | FALSE | MCAM;Adhesome;OmniPath | generic | functional | resource_specific | ITGA8 | protein | 3 | TRUE | TRUE | FALSE | TRUE | FALSE | ||
| adhesion | adhesion | A4D0S4 | P53708 | matrix_adhesion | matrix_adhesion | ITGA8 | LAMB4 | 1 | 1 | 0 | 1 | 1 | 0 | Wang | 0 | 0 | 1 | OmniPath | generic | functional | composite | LAMB4 | protein | 1 | TRUE | TRUE | TRUE | FALSE | FALSE | Zhong2015;OmniPath | generic | functional | resource_specific | ITGA8 | protein | 1 | FALSE | TRUE | FALSE | TRUE | FALSE | ||
| adhesion | adhesion | A4D0S4 | P53708 | receptor | receptor | ITGA8 | LAMB4 | 1 | 1 | 0 | 1 | 1 | 0 | Wang | 0 | 0 | 1 | OmniPath | generic | functional | composite | LAMB4 | protein | 1 | TRUE | TRUE | TRUE | FALSE | FALSE | iTALK;Almen2009;CellCellInteractions;EMBRACE;CellPhoneDB;GO_Intercell;HPMR;Surfaceome;Ramilowski2015;LRdb;OmniPath | generic | functional | resource_specific | ITGA8 | protein | 10 | FALSE | TRUE | FALSE | TRUE | FALSE | ||
| adhesion | adhesion | A4D0S4 | P56199 | adhesion | adhesion | ITGA1 | LAMB4 | 1 | 1 | 0 | 1 | 1 | 0 | Wang | 0 | 0 | 1 | OmniPath | generic | functional | composite | LAMB4 | protein | 1 | TRUE | TRUE | TRUE | FALSE | FALSE | Adhesome;OmniPath | generic | functional | resource_specific | ITGA1 | protein | 2 | TRUE | TRUE | FALSE | TRUE | FALSE | ||
| adhesion | adhesion | A4D0S4 | P56199 | matrix_adhesion | matrix_adhesion | ITGA1 | LAMB4 | 1 | 1 | 0 | 1 | 1 | 0 | Wang | 0 | 0 | 1 | OmniPath | generic | functional | composite | LAMB4 | protein | 1 | TRUE | TRUE | TRUE | FALSE | FALSE | Zhong2015;OmniPath | generic | functional | resource_specific | ITGA1 | protein | 1 | FALSE | TRUE | FALSE | TRUE | FALSE | ||
| adhesion | adhesion | A4D0S4 | P56199 | receptor | receptor | ITGA1 | LAMB4 | 1 | 1 | 0 | 1 | 1 | 0 | Wang | 0 | 0 | 1 | OmniPath | generic | functional | composite | LAMB4 | protein | 1 | TRUE | TRUE | TRUE | FALSE | FALSE | iTALK;Almen2009;CellCellInteractions;EMBRACE;CellPhoneDB;GO_Intercell;ICELLNET;Surfaceome;Ramilowski2015;LRdb;OmniPath | generic | functional | resource_specific | ITGA1 | protein | 10 | FALSE | TRUE | FALSE | TRUE | FALSE | ||
| adhesion | adhesion | A4D0S4 | Q13683 | adhesion | adhesion | ITGA7 | LAMB4 | 1 | 1 | 0 | 1 | 1 | 0 | Wang | 0 | 0 | 1 | OmniPath | generic | functional | composite | LAMB4 | protein | 1 | TRUE | TRUE | TRUE | FALSE | FALSE | Adhesome;OmniPath | generic | functional | resource_specific | ITGA7 | protein | 2 | TRUE | TRUE | FALSE | TRUE | FALSE | ||
| adhesion | adhesion | A4D0S4 | Q13683 | matrix_adhesion | matrix_adhesion | ITGA7 | LAMB4 | 1 | 1 | 0 | 1 | 1 | 0 | Wang | 0 | 0 | 1 | OmniPath | generic | functional | composite | LAMB4 | protein | 1 | TRUE | TRUE | TRUE | FALSE | FALSE | Zhong2015;OmniPath | generic | functional | resource_specific | ITGA7 | protein | 1 | FALSE | TRUE | FALSE | TRUE | FALSE | ||
| adhesion | adhesion | A4D0S4 | Q13683 | receptor | receptor | ITGA7 | LAMB4 | 1 | 1 | 0 | 1 | 1 | 0 | Wang | 0 | 0 | 1 | OmniPath | generic | functional | composite | LAMB4 | protein | 1 | TRUE | TRUE | TRUE | FALSE | FALSE | iTALK;Almen2009;CellCellInteractions;CellPhoneDB;GO_Intercell;HPMR;Surfaceome;Ramilowski2015;LRdb;OmniPath | generic | functional | resource_specific | ITGA7 | protein | 9 | FALSE | TRUE | FALSE | TRUE | FALSE | ||
| adhesion | adhesion | A4D0S4 | Q13797 | adhesion | adhesion | ITGA9 | LAMB4 | 1 | 1 | 0 | 1 | 1 | 0 | Wang | 0 | 0 | 1 | OmniPath | generic | functional | composite | LAMB4 | protein | 1 | TRUE | TRUE | TRUE | FALSE | FALSE | MCAM;Adhesome;OmniPath | generic | functional | resource_specific | ITGA9 | protein | 3 | TRUE | TRUE | FALSE | TRUE | FALSE | ||
| adhesion | adhesion | A4D0S4 | Q13797 | cell_adhesion | cell_adhesion | ITGA9 | LAMB4 | 1 | 1 | 0 | 1 | 1 | 0 | Wang | 0 | 0 | 1 | OmniPath | generic | functional | composite | LAMB4 | protein | 1 | TRUE | TRUE | TRUE | FALSE | FALSE | OmniPath | generic | functional | composite | ITGA9 | protein | 0 | TRUE | TRUE | FALSE | TRUE | FALSE | ||
| adhesion | adhesion | A4D0S4 | Q13797 | matrix_adhesion | matrix_adhesion | ITGA9 | LAMB4 | 1 | 1 | 0 | 1 | 1 | 0 | Wang | 0 | 0 | 1 | OmniPath | generic | functional | composite | LAMB4 | protein | 1 | TRUE | TRUE | TRUE | FALSE | FALSE | Zhong2015;OmniPath | generic | functional | resource_specific | ITGA9 | protein | 1 | FALSE | TRUE | FALSE | TRUE | FALSE | ||
| adhesion | adhesion | A4D0S4 | Q13797 | receptor | receptor | ITGA9 | LAMB4 | 1 | 1 | 0 | 1 | 1 | 0 | Wang | 0 | 0 | 1 | OmniPath | generic | functional | composite | LAMB4 | protein | 1 | TRUE | TRUE | TRUE | FALSE | FALSE | iTALK;Almen2009;CellCellInteractions;EMBRACE;CellPhoneDB;HPMR;ICELLNET;Surfaceome;Ramilowski2015;LRdb;OmniPath | generic | functional | resource_specific | ITGA9 | protein | 10 | FALSE | TRUE | FALSE | TRUE | FALSE | ||
| adhesion | adhesion | A4D0S4 | Q14118 | receptor | receptor | DAG1 | LAMB4 | 1 | 1 | 0 | 1 | 1 | 0 | Wang | 0 | 0 | 1 | OmniPath | generic | functional | composite | LAMB4 | protein | 1 | TRUE | TRUE | TRUE | FALSE | FALSE | CellCellInteractions;CellPhoneDB;OmniPath | generic | functional | resource_specific | DAG1 | protein | 2 | FALSE | TRUE | TRUE | TRUE | FALSE | ||
| adhesion | adhesion | A4D0S4 | Q496J9 | transporter | transporter | SV2C | LAMB4 | 1 | 1 | 0 | 1 | 1 | 0 | Wang | 0 | 0 | 1 | OmniPath | generic | functional | composite | LAMB4 | protein | 1 | TRUE | TRUE | TRUE | FALSE | FALSE | OmniPath | generic | functional | composite | SV2C | protein | 0 | FALSE | TRUE | FALSE | FALSE | FALSE | ||
| adhesion | adhesion | A4D0S4 | Q7L0J3 | transporter | transporter | SV2A | LAMB4 | 1 | 1 | 0 | 1 | 1 | 0 | Wang | 0 | 0 | 1 | OmniPath | generic | functional | composite | LAMB4 | protein | 1 | TRUE | TRUE | TRUE | FALSE | FALSE | Surfaceome;OmniPath | generic | functional | resource_specific | SV2A | protein | 1 | FALSE | TRUE | FALSE | TRUE | FALSE | ||
| adhesion | adhesion | A4D0S4 | Q7L1I2 | transporter | transporter | SV2B | LAMB4 | 1 | 1 | 0 | 1 | 1 | 0 | Wang | 0 | 0 | 1 | OmniPath | generic | functional | composite | LAMB4 | protein | 1 | TRUE | TRUE | TRUE | FALSE | FALSE | OmniPath | generic | functional | composite | SV2B | protein | 0 | FALSE | TRUE | FALSE | FALSE | FALSE | ||
| adhesion | adhesion | A4D0S4 | Q9UKX5 | adhesion | adhesion | ITGA11 | LAMB4 | 1 | 1 | 0 | 1 | 1 | 0 | Wang | 0 | 0 | 1 | OmniPath | generic | functional | composite | LAMB4 | protein | 1 | TRUE | TRUE | TRUE | FALSE | FALSE | MCAM;Adhesome;OmniPath | generic | functional | resource_specific | ITGA11 | protein | 3 | TRUE | TRUE | FALSE | TRUE | FALSE | ||
| adhesion | adhesion | A4D0S4 | Q9UKX5 | matrix_adhesion | matrix_adhesion | ITGA11 | LAMB4 | 1 | 1 | 0 | 1 | 1 | 0 | Wang | 0 | 0 | 1 | OmniPath | generic | functional | composite | LAMB4 | protein | 1 | TRUE | TRUE | TRUE | FALSE | FALSE | Zhong2015;OmniPath | generic | functional | resource_specific | ITGA11 | protein | 1 | FALSE | TRUE | FALSE | TRUE | FALSE | ||
| adhesion | adhesion | A4D0S4 | Q9UKX5 | receptor | receptor | ITGA11 | LAMB4 | 1 | 1 | 0 | 1 | 1 | 0 | Wang | 0 | 0 | 1 | OmniPath | generic | functional | composite | LAMB4 | protein | 1 | TRUE | TRUE | TRUE | FALSE | FALSE | iTALK;Almen2009;CellCellInteractions;CellPhoneDB;HPMR;Surfaceome;Ramilowski2015;LRdb;OmniPath | generic | functional | resource_specific | ITGA11 | protein | 8 | FALSE | TRUE | FALSE | TRUE | FALSE | ||
| adhesion | adhesion | COMPLEX:P05106_P06756 | P16284 | adhesion | adhesion | PECAM1 | ITGAV_ITGB3 | 1 | 0 | 0 | 0 | 0 | 0 | Baccin2019 | Baccin2019:7542249 | 1 | 1 | 1 | Adhesome;OmniPath | generic | functional | resource_specific | COMPLEX:ITGAV_ITGB3 | complex | 2 | TRUE | TRUE | FALSE | TRUE | FALSE | HGNC;MCAM;OmniPath | generic | functional | resource_specific | PECAM1 | protein | 4 | TRUE | TRUE | FALSE | TRUE | FALSE | |
| adhesion | adhesion | COMPLEX:P05106_P06756 | P16284 | cell_adhesion | cell_adhesion | PECAM1 | ITGAV_ITGB3 | 1 | 0 | 0 | 0 | 0 | 0 | Baccin2019 | Baccin2019:7542249 | 1 | 1 | 1 | Adhesome;OmniPath | generic | functional | resource_specific | COMPLEX:ITGAV_ITGB3 | complex | 2 | TRUE | TRUE | FALSE | TRUE | FALSE | Zhong2015;HGNC;OmniPath | generic | functional | resource_specific | PECAM1 | protein | 2 | TRUE | TRUE | FALSE | TRUE | FALSE | |
| adhesion | adhesion | COMPLEX:P05106_P06756 | P16284 | receptor | receptor | PECAM1 | ITGAV_ITGB3 | 1 | 0 | 0 | 0 | 0 | 0 | Baccin2019 | Baccin2019:7542249 | 1 | 1 | 1 | Adhesome;OmniPath | generic | functional | resource_specific | COMPLEX:ITGAV_ITGB3 | complex | 2 | TRUE | TRUE | FALSE | TRUE | FALSE | iTALK;EMBRACE;CellPhoneDB;GO_Intercell;Ramilowski2015;LRdb;Baccin2019;OmniPath | generic | functional | resource_specific | PECAM1 | protein | 7 | FALSE | TRUE | FALSE | TRUE | FALSE | |
| adhesion | adhesion | COMPLEX:P05106_P06756 | Q14773 | adhesion | adhesion | ICAM4 | ITGAV_ITGB3 | 1 | 0 | 0 | 0 | 0 | 0 | Baccin2019 | Baccin2019:16988024 | 1 | 1 | 1 | Adhesome;OmniPath | generic | functional | resource_specific | COMPLEX:ITGAV_ITGB3 | complex | 2 | TRUE | TRUE | FALSE | TRUE | FALSE | HGNC;MCAM;OmniPath | generic | functional | resource_specific | ICAM4 | protein | 4 | TRUE | TRUE | TRUE | TRUE | FALSE | |
| adhesion | adhesion | COMPLEX:P05106_P06756 | Q14773 | cell_adhesion | cell_adhesion | ICAM4 | ITGAV_ITGB3 | 1 | 0 | 0 | 0 | 0 | 0 | Baccin2019 | Baccin2019:16988024 | 1 | 1 | 1 | Adhesome;OmniPath | generic | functional | resource_specific | COMPLEX:ITGAV_ITGB3 | complex | 2 | TRUE | TRUE | FALSE | TRUE | FALSE | Zhong2015;HGNC;OmniPath | generic | functional | resource_specific | ICAM4 | protein | 2 | TRUE | TRUE | TRUE | TRUE | FALSE | |
| adhesion | adhesion | COMPLEX:P05106_P08514 | Q14773 | adhesion | adhesion | ICAM4 | ITGA2B_ITGB3 | 1 | 0 | 0 | 0 | 0 | 0 | Baccin2019 | Baccin2019:16988024 | 1 | 1 | 1 | OmniPath | generic | functional | composite | COMPLEX:ITGA2B_ITGB3 | complex | 1 | TRUE | TRUE | FALSE | TRUE | FALSE | HGNC;MCAM;OmniPath | generic | functional | resource_specific | ICAM4 | protein | 4 | TRUE | TRUE | TRUE | TRUE | FALSE | |
| adhesion | adhesion | COMPLEX:P05106_P08514 | Q14773 | cell_adhesion | cell_adhesion | ICAM4 | ITGA2B_ITGB3 | 1 | 0 | 0 | 0 | 0 | 0 | Baccin2019 | Baccin2019:16988024 | 1 | 1 | 1 | OmniPath | generic | functional | composite | COMPLEX:ITGA2B_ITGB3 | complex | 1 | TRUE | TRUE | FALSE | TRUE | FALSE | Zhong2015;HGNC;OmniPath | generic | functional | resource_specific | ICAM4 | protein | 2 | TRUE | TRUE | TRUE | TRUE | FALSE | |
| adhesion | adhesion | COMPLEX:P05556_P13612 | P08571 | receptor | receptor | CD14 | ITGA4_ITGB1 | 1 | 0 | 0 | 0 | 0 | 0 | Baccin2019 | Baccin2019:17274987 | 1 | 1 | 1 | Adhesome;OmniPath | generic | functional | resource_specific | COMPLEX:ITGA4_ITGB1 | complex | 2 | TRUE | TRUE | FALSE | TRUE | FALSE | CellCellInteractions;HGNC;GO_Intercell;Baccin2019;OmniPath | generic | functional | resource_specific | CD14 | protein | 4 | FALSE | TRUE | TRUE | FALSE | TRUE | |
| adhesion | adhesion | COMPLEX:P05556_P13612 | P57087 | adhesion | adhesion | JAM2 | ITGA4_ITGB1 | 1 | 0 | 0 | 0 | 0 | 0 | Baccin2019;CellPhoneDB | 0 | 0 | 2 | Adhesome;OmniPath | generic | functional | resource_specific | COMPLEX:ITGA4_ITGB1 | complex | 2 | TRUE | TRUE | FALSE | TRUE | FALSE | HGNC;OmniPath | generic | functional | resource_specific | JAM2 | protein | 2 | TRUE | TRUE | FALSE | TRUE | FALSE | ||
| adhesion | adhesion | COMPLEX:P05556_P13612 | P57087 | cell_adhesion | cell_adhesion | JAM2 | ITGA4_ITGB1 | 1 | 0 | 0 | 0 | 0 | 0 | Baccin2019;CellPhoneDB | 0 | 0 | 2 | Adhesome;OmniPath | generic | functional | resource_specific | COMPLEX:ITGA4_ITGB1 | complex | 2 | TRUE | TRUE | FALSE | TRUE | FALSE | HGNC;OmniPath | generic | functional | resource_specific | JAM2 | protein | 1 | TRUE | TRUE | FALSE | TRUE | FALSE | ||
| adhesion | adhesion | COMPLEX:P05556_P13612 | P57087 | tight_junction | tight_junction | JAM2 | ITGA4_ITGB1 | 1 | 0 | 0 | 0 | 0 | 0 | Baccin2019;CellPhoneDB | 0 | 0 | 2 | Adhesome;OmniPath | generic | functional | resource_specific | COMPLEX:ITGA4_ITGB1 | complex | 2 | TRUE | TRUE | FALSE | TRUE | FALSE | GO_Intercell;Zhong2015;OmniPath | generic | functional | resource_specific | JAM2 | protein | 2 | TRUE | TRUE | FALSE | TRUE | FALSE | ||
| adhesion | adhesion | COMPLEX:P05556_P13612 | Q14773 | adhesion | adhesion | ICAM4 | ITGA4_ITGB1 | 1 | 0 | 0 | 0 | 0 | 0 | Baccin2019 | Baccin2019:16988024 | 1 | 1 | 1 | Adhesome;OmniPath | generic | functional | resource_specific | COMPLEX:ITGA4_ITGB1 | complex | 2 | TRUE | TRUE | FALSE | TRUE | FALSE | HGNC;MCAM;OmniPath | generic | functional | resource_specific | ICAM4 | protein | 4 | TRUE | TRUE | TRUE | TRUE | FALSE | |
| adhesion | adhesion | COMPLEX:P05556_P13612 | Q14773 | cell_adhesion | cell_adhesion | ICAM4 | ITGA4_ITGB1 | 1 | 0 | 0 | 0 | 0 | 0 | Baccin2019 | Baccin2019:16988024 | 1 | 1 | 1 | Adhesome;OmniPath | generic | functional | resource_specific | COMPLEX:ITGA4_ITGB1 | complex | 2 | TRUE | TRUE | FALSE | TRUE | FALSE | Zhong2015;HGNC;OmniPath | generic | functional | resource_specific | ICAM4 | protein | 2 | TRUE | TRUE | TRUE | TRUE | FALSE | |
| adhesion | adhesion | O00548 | P46531 | adhesion | adhesion | NOTCH1 | DLL1 | 1 | 1 | 0 | 1 | 1 | 0 | Baccin2019;CellPhoneDB;EMBRACE;Fantom5_LRdb;HPMR_LRdb;HPRD;HPRD_LRdb;KEGG-MEDICUS;Kirouac2010;LRdb;NetPath;Ramilowski2015;Ramilowski2015_Baccin2019;SIGNOR;SPIKE;UniProt_LRdb;Wang;iTALK | Baccin2019:1006133;Baccin2019:98194281;CellPhoneDB:22353464;HPRD:11006133;LRdb:11;LRdb:9819428;NetPath:11006133;SIGNOR:16140393;SPIKE:11006133;SPIKE:17537801 | 10 | 8 | 13 | MCAM;OmniPath | generic | functional | resource_specific | DLL1 | protein | 1 | TRUE | TRUE | FALSE | TRUE | FALSE | OmniPath | generic | functional | composite | NOTCH1 | protein | 1 | TRUE | TRUE | FALSE | TRUE | FALSE | |
| adhesion | adhesion | O00548 | P46531 | cell_adhesion | cell_adhesion | NOTCH1 | DLL1 | 1 | 1 | 0 | 1 | 1 | 0 | Baccin2019;CellPhoneDB;EMBRACE;Fantom5_LRdb;HPMR_LRdb;HPRD;HPRD_LRdb;KEGG-MEDICUS;Kirouac2010;LRdb;NetPath;Ramilowski2015;Ramilowski2015_Baccin2019;SIGNOR;SPIKE;UniProt_LRdb;Wang;iTALK | Baccin2019:1006133;Baccin2019:98194281;CellPhoneDB:22353464;HPRD:11006133;LRdb:11;LRdb:9819428;NetPath:11006133;SIGNOR:16140393;SPIKE:11006133;SPIKE:17537801 | 10 | 8 | 13 | MCAM;OmniPath | generic | functional | resource_specific | DLL1 | protein | 1 | TRUE | TRUE | FALSE | TRUE | FALSE | Zhong2015;OmniPath | generic | functional | resource_specific | NOTCH1 | protein | 1 | TRUE | TRUE | FALSE | TRUE | FALSE | |
| adhesion | adhesion | O00548 | P46531 | receptor | receptor | NOTCH1 | DLL1 | 1 | 1 | 0 | 1 | 1 | 0 | Baccin2019;CellPhoneDB;EMBRACE;Fantom5_LRdb;HPMR_LRdb;HPRD;HPRD_LRdb;KEGG-MEDICUS;Kirouac2010;LRdb;NetPath;Ramilowski2015;Ramilowski2015_Baccin2019;SIGNOR;SPIKE;UniProt_LRdb;Wang;iTALK | Baccin2019:1006133;Baccin2019:98194281;CellPhoneDB:22353464;HPRD:11006133;LRdb:11;LRdb:9819428;NetPath:11006133;SIGNOR:16140393;SPIKE:11006133;SPIKE:17537801 | 10 | 8 | 13 | MCAM;OmniPath | generic | functional | resource_specific | DLL1 | protein | 1 | TRUE | TRUE | FALSE | TRUE | FALSE | iTALK;CellCellInteractions;EMBRACE;HGNC;CellPhoneDB;HPMR;ICELLNET;Surfaceome;Ramilowski2015;Kirouac2010;LRdb;Baccin2019;SignaLink_function;OmniPath | generic | functional | resource_specific | NOTCH1 | protein | 13 | FALSE | TRUE | FALSE | TRUE | FALSE | |
| adhesion | adhesion | O00548 | Q04721 | receptor | receptor | NOTCH2 | DLL1 | 1 | 1 | 0 | 1 | 1 | 0 | Baccin2019;BioGRID;CellPhoneDB;Fantom5_LRdb;HPRD;HPRD_LRdb;KEGG-MEDICUS;LRdb;NetPath;Ramilowski2015;Ramilowski2015_Baccin2019;SIGNOR;UniProt_LRdb;Wang;iTALK | Baccin2019:10958687;BioGRID:9244302;CellPhoneDB:22353464;HPRD:10958687;LRdb:10958687;NetPath:10958687;SIGNOR:16140393;SIGNOR:23111325 | 8 | 5 | 11 | MCAM;OmniPath | generic | functional | resource_specific | DLL1 | protein | 1 | TRUE | TRUE | FALSE | TRUE | FALSE | iTALK;Almen2009;CellCellInteractions;HGNC;CellPhoneDB;GO_Intercell;HPMR;ICELLNET;Surfaceome;Ramilowski2015;LRdb;Baccin2019;SignaLink_function;OmniPath | generic | functional | resource_specific | NOTCH2 | protein | 13 | FALSE | TRUE | FALSE | TRUE | FALSE | |
| adhesion | adhesion | O00548 | Q99466 | receptor | receptor | NOTCH4 | DLL1 | 1 | 1 | 0 | 1 | 1 | 0 | CellPhoneDB;EMBRACE;KEGG-MEDICUS;LRdb;SIGNOR;UniProt_LRdb;Wang;iTALK | CellPhoneDB:22353464;SIGNOR:16140393 | 2 | 2 | 7 | MCAM;OmniPath | generic | functional | resource_specific | DLL1 | protein | 1 | TRUE | TRUE | FALSE | TRUE | FALSE | iTALK;Almen2009;CellCellInteractions;EMBRACE;HGNC;CellPhoneDB;GO_Intercell;HPMR;ICELLNET;Surfaceome;Ramilowski2015;LRdb;Baccin2019;SignaLink_function;OmniPath | generic | functional | resource_specific | NOTCH4 | protein | 14 | FALSE | TRUE | FALSE | TRUE | FALSE | |
| adhesion | adhesion | O00548 | Q9UM47 | receptor | receptor | NOTCH3 | DLL1 | 1 | 1 | 0 | 1 | 1 | 0 | Baccin2019;CancerCellMap;CellPhoneDB;EMBRACE;Fantom5_LRdb;HPRD;HPRD_LRdb;KEGG-MEDICUS;LRdb;NetPath;Ramilowski2015;Ramilowski2015_Baccin2019;SIGNOR;UniProt_LRdb;Wang;iTALK | Baccin2019:11006133;Baccin2019:12482954;CancerCellMap:11006133;CellPhoneDB:22353464;HPRD:11006133;HPRD:12482954;LRdb:11;LRdb:12482954;NetPath:11006133;SIGNOR:11006133;SIGNOR:16140393 | 11 | 5 | 12 | MCAM;OmniPath | generic | functional | resource_specific | DLL1 | protein | 1 | TRUE | TRUE | FALSE | TRUE | FALSE | iTALK;Almen2009;CellCellInteractions;EMBRACE;HGNC;CellPhoneDB;HPMR;ICELLNET;Surfaceome;Ramilowski2015;LRdb;Baccin2019;SignaLink_function;OmniPath | generic | functional | resource_specific | NOTCH3 | protein | 13 | FALSE | TRUE | FALSE | TRUE | FALSE | |
| adhesion | adhesion | O14522 | O60716 | adhesion | adhesion | CTNND1 | PTPRT | 1 | 0 | 0 | 0 | 0 | 0 | DEPOD | DEPOD:16973135 | 1 | 1 | 1 | OmniPath | generic | functional | composite | PTPRT | protein | 1 | TRUE | TRUE | FALSE | TRUE | FALSE | OmniPath | generic | functional | composite | CTNND1 | protein | 1 | TRUE | TRUE | FALSE | FALSE | FALSE | |
| adhesion | adhesion | O14522 | O60716 | cell_adhesion | cell_adhesion | CTNND1 | PTPRT | 1 | 0 | 0 | 0 | 0 | 0 | DEPOD | DEPOD:16973135 | 1 | 1 | 1 | OmniPath | generic | functional | composite | PTPRT | protein | 1 | TRUE | TRUE | FALSE | TRUE | FALSE | Zhong2015;OmniPath | generic | functional | resource_specific | CTNND1 | protein | 1 | TRUE | TRUE | FALSE | FALSE | FALSE | |
| adhesion | adhesion | O14522 | P12830 | adhesion | adhesion | CDH1 | PTPRT | 1 | 0 | 0 | 0 | 0 | 0 | DEPOD | DEPOD:16973135 | 1 | 1 | 1 | OmniPath | generic | functional | composite | PTPRT | protein | 1 | TRUE | TRUE | FALSE | TRUE | FALSE | HGNC;OmniPath | generic | functional | resource_specific | CDH1 | protein | 3 | TRUE | TRUE | FALSE | TRUE | FALSE | |
| adhesion | adhesion | O14522 | P12830 | cell_adhesion | cell_adhesion | CDH1 | PTPRT | 1 | 0 | 0 | 0 | 0 | 0 | DEPOD | DEPOD:16973135 | 1 | 1 | 1 | OmniPath | generic | functional | composite | PTPRT | protein | 1 | TRUE | TRUE | FALSE | TRUE | FALSE | Zhong2015;HGNC;OmniPath | generic | functional | resource_specific | CDH1 | protein | 2 | TRUE | TRUE | FALSE | TRUE | FALSE | |
| adhesion | adhesion | O14594 | O75056 | adhesion | adhesion | SDC3 | NCAN | 1 | 0 | 0 | 0 | 0 | 0 | EMBRACE;Fantom5_LRdb;LRdb;iTALK | 0 | 0 | 3 | OmniPath | generic | functional | composite | NCAN | protein | 1 | TRUE | TRUE | TRUE | FALSE | FALSE | OmniPath | generic | functional | composite | SDC3 | protein | 1 | TRUE | TRUE | FALSE | TRUE | FALSE | ||
| adhesion | adhesion | O14594 | O75056 | cell_adhesion | cell_adhesion | SDC3 | NCAN | 1 | 0 | 0 | 0 | 0 | 0 | EMBRACE;Fantom5_LRdb;LRdb;iTALK | 0 | 0 | 3 | OmniPath | generic | functional | composite | NCAN | protein | 1 | TRUE | TRUE | TRUE | FALSE | FALSE | Zhong2015;OmniPath | generic | functional | resource_specific | SDC3 | protein | 1 | TRUE | TRUE | FALSE | TRUE | FALSE | ||
| adhesion | adhesion | O14594 | O75056 | receptor | receptor | SDC3 | NCAN | 1 | 0 | 0 | 0 | 0 | 0 | EMBRACE;Fantom5_LRdb;LRdb;iTALK | 0 | 0 | 3 | OmniPath | generic | functional | composite | NCAN | protein | 1 | TRUE | TRUE | TRUE | FALSE | FALSE | iTALK;Almen2009;EMBRACE;HPMR;Ramilowski2015;LRdb;Baccin2019;OmniPath | generic | functional | resource_specific | SDC3 | protein | 7 | FALSE | TRUE | FALSE | TRUE | FALSE | ||
| adhesion | adhesion | O14594 | P19022 | adhesion | adhesion | CDH2 | NCAN | 1 | 0 | 0 | 0 | 0 | 0 | EMBRACE;Fantom5_LRdb;LRdb;iTALK | 0 | 0 | 3 | OmniPath | generic | functional | composite | NCAN | protein | 1 | TRUE | TRUE | TRUE | FALSE | FALSE | HGNC;OmniPath | generic | functional | resource_specific | CDH2 | protein | 4 | TRUE | TRUE | FALSE | TRUE | FALSE | ||
| adhesion | adhesion | O14594 | P19022 | cell_adhesion | cell_adhesion | CDH2 | NCAN | 1 | 0 | 0 | 0 | 0 | 0 | EMBRACE;Fantom5_LRdb;LRdb;iTALK | 0 | 0 | 3 | OmniPath | generic | functional | composite | NCAN | protein | 1 | TRUE | TRUE | TRUE | FALSE | FALSE | Zhong2015;Almen2009;HGNC;OmniPath | generic | functional | resource_specific | CDH2 | protein | 3 | TRUE | TRUE | FALSE | TRUE | FALSE | ||
| adhesion | adhesion | O14594 | P19022 | receptor | receptor | CDH2 | NCAN | 1 | 0 | 0 | 0 | 0 | 0 | EMBRACE;Fantom5_LRdb;LRdb;iTALK | 0 | 0 | 3 | OmniPath | generic | functional | composite | NCAN | protein | 1 | TRUE | TRUE | TRUE | FALSE | FALSE | iTALK;CellCellInteractions;EMBRACE;GO_Intercell;Baccin2019;OmniPath | generic | functional | resource_specific | CDH2 | protein | 5 | FALSE | TRUE | FALSE | TRUE | FALSE | ||
| adhesion | adhesion | O14713 | P05106 | adhesion | adhesion | ITGB3 | ITGB1BP1 | 1 | 0 | 1 | 1 | 0 | 1 | SIGNOR | SIGNOR:19118207 | 1 | 1 | 1 | OmniPath | generic | functional | composite | ITGB1BP1 | protein | 1 | TRUE | TRUE | FALSE | TRUE | FALSE | Adhesome;OmniPath | generic | functional | resource_specific | ITGB3 | protein | 2 | TRUE | TRUE | FALSE | TRUE | FALSE | |
| adhesion | adhesion | O14713 | P05106 | matrix_adhesion | matrix_adhesion | ITGB3 | ITGB1BP1 | 1 | 0 | 1 | 1 | 0 | 1 | SIGNOR | SIGNOR:19118207 | 1 | 1 | 1 | OmniPath | generic | functional | composite | ITGB1BP1 | protein | 1 | TRUE | TRUE | FALSE | TRUE | FALSE | Zhong2015;OmniPath | generic | functional | resource_specific | ITGB3 | protein | 1 | FALSE | TRUE | FALSE | TRUE | FALSE | |
| adhesion | adhesion | O14713 | P05106 | receptor | receptor | ITGB3 | ITGB1BP1 | 1 | 0 | 1 | 1 | 0 | 1 | SIGNOR | SIGNOR:19118207 | 1 | 1 | 1 | OmniPath | generic | functional | composite | ITGB1BP1 | protein | 1 | TRUE | TRUE | FALSE | TRUE | FALSE | iTALK;Almen2009;CellCellInteractions;EMBRACE;CellPhoneDB;GO_Intercell;HPMR;Surfaceome;Ramilowski2015;LRdb;Baccin2019;OmniPath | generic | functional | resource_specific | ITGB3 | protein | 11 | FALSE | TRUE | FALSE | TRUE | FALSE | |
| adhesion | adhesion | O14713 | P05107 | adhesion | adhesion | ITGB2 | ITGB1BP1 | 1 | 0 | 1 | 1 | 0 | 1 | SIGNOR | SIGNOR:19118207 | 1 | 1 | 1 | OmniPath | generic | functional | composite | ITGB1BP1 | protein | 1 | TRUE | TRUE | FALSE | TRUE | FALSE | MCAM;Adhesome;OmniPath | generic | functional | resource_specific | ITGB2 | protein | 3 | TRUE | TRUE | FALSE | TRUE | FALSE | |
| adhesion | adhesion | O14713 | P05107 | cell_adhesion | cell_adhesion | ITGB2 | ITGB1BP1 | 1 | 0 | 1 | 1 | 0 | 1 | SIGNOR | SIGNOR:19118207 | 1 | 1 | 1 | OmniPath | generic | functional | composite | ITGB1BP1 | protein | 1 | TRUE | TRUE | FALSE | TRUE | FALSE | OmniPath | generic | functional | composite | ITGB2 | protein | 0 | TRUE | TRUE | FALSE | TRUE | FALSE | |
| adhesion | adhesion | O14713 | P05107 | matrix_adhesion | matrix_adhesion | ITGB2 | ITGB1BP1 | 1 | 0 | 1 | 1 | 0 | 1 | SIGNOR | SIGNOR:19118207 | 1 | 1 | 1 | OmniPath | generic | functional | composite | ITGB1BP1 | protein | 1 | TRUE | TRUE | FALSE | TRUE | FALSE | Zhong2015;OmniPath | generic | functional | resource_specific | ITGB2 | protein | 1 | FALSE | TRUE | FALSE | TRUE | FALSE | |
| adhesion | adhesion | O14713 | P05107 | receptor | receptor | ITGB2 | ITGB1BP1 | 1 | 0 | 1 | 1 | 0 | 1 | SIGNOR | SIGNOR:19118207 | 1 | 1 | 1 | OmniPath | generic | functional | composite | ITGB1BP1 | protein | 1 | TRUE | TRUE | FALSE | TRUE | FALSE | iTALK;Almen2009;CellCellInteractions;EMBRACE;CellPhoneDB;GO_Intercell;HPMR;Surfaceome;Ramilowski2015;LRdb;Baccin2019;OmniPath | generic | functional | resource_specific | ITGB2 | protein | 11 | FALSE | TRUE | FALSE | TRUE | FALSE |
There are 44 columns to explore:
sort(colnames(icn))
##  [1] "aspect_intercell_source"
##  [2] "aspect_intercell_target"
##  [3] "category_intercell_source"
##  [4] "category_intercell_target"
##  [5] "category_source_intercell_source"
##  [6] "category_source_intercell_target"
##  [7] "consensus_direction"
##  [8] "consensus_inhibition"
##  [9] "consensus_score_intercell_source"
## [10] "consensus_score_intercell_target"
## [11] "consensus_stimulation"
## [12] "curation_effort"
## [13] "database_intercell_source"
## [14] "database_intercell_target"
## [15] "dip_url"
## [16] "entity_type_intercell_source"
## [17] "entity_type_intercell_target"
## [18] "genesymbol_intercell_source"
## [19] "genesymbol_intercell_target"
## [20] "is_directed"
## [21] "is_inhibition"
## [22] "is_stimulation"
## [23] "n_references"
## [24] "n_resources"
## [25] "parent_intercell_source"
## [26] "parent_intercell_target"
## [27] "plasma_membrane_peripheral_intercell_source"
## [28] "plasma_membrane_peripheral_intercell_target"
## [29] "plasma_membrane_transmembrane_intercell_source"
## [30] "plasma_membrane_transmembrane_intercell_target"
## [31] "receiver_intercell_source"
## [32] "receiver_intercell_target"
## [33] "references"
## [34] "scope_intercell_source"
## [35] "scope_intercell_target"
## [36] "secreted_intercell_source"
## [37] "secreted_intercell_target"
## [38] "source"
## [39] "source_genesymbol"
## [40] "sources"
## [41] "target"
## [42] "target_genesymbol"
## [43] "transmitter_intercell_source"
## [44] "transmitter_intercell_target"
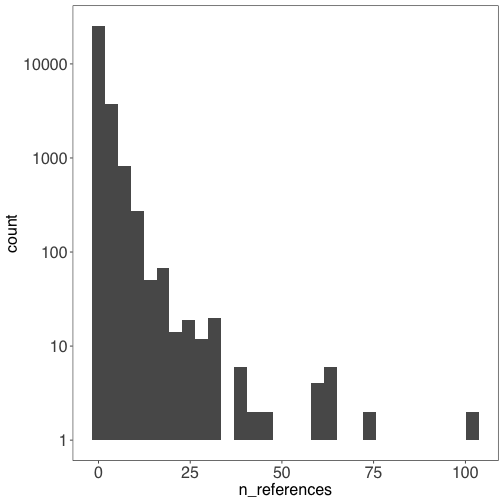
Show how many references support each record #
There are 13,126 records with 0 references, and 17,139 records with at least 1 reference.
This histogram summarizes the number of records (y-axis) with each number of supporting references (x-axis).
library(ggplot2)

ggplot(icn) +
  geom_histogram(aes(n_references)) +
  scale_y_continuous(trans = "log10")
I’m not sure what the ID numbers mean, but it looks like there are some references and databases listed here:
icn$references[which(icn$n_references > 2)[1:5]]
## [1] "Baccin2019:1006133;Baccin2019:98194281;CellPhoneDB:22353464;HPRD:11006133;LRdb:11;LRdb:9819428;NetPath:11006133;SIGNOR:16140393;SPIKE:11006133;SPIKE:17537801"
## [2] "Baccin2019:1006133;Baccin2019:98194281;CellPhoneDB:22353464;HPRD:11006133;LRdb:11;LRdb:9819428;NetPath:11006133;SIGNOR:16140393;SPIKE:11006133;SPIKE:17537801"
## [3] "Baccin2019:1006133;Baccin2019:98194281;CellPhoneDB:22353464;HPRD:11006133;LRdb:11;LRdb:9819428;NetPath:11006133;SIGNOR:16140393;SPIKE:11006133;SPIKE:17537801"
## [4] "Baccin2019:10958687;BioGRID:9244302;CellPhoneDB:22353464;HPRD:10958687;LRdb:10958687;NetPath:10958687;SIGNOR:16140393;SIGNOR:23111325"
## [5] "Baccin2019:11006133;Baccin2019:12482954;CancerCellMap:11006133;CellPhoneDB:22353464;HPRD:11006133;HPRD:12482954;LRdb:11;LRdb:12482954;NetPath:11006133;SIGNOR:11006133;SIGNOR:16140393"
Filter the table #
Let’s filter the table to source-target pairs where the consensus score for the source is greater than 4. Then we can take a subset of the columns, to simplify the table.
omni <- icn %>%
  dplyr::filter(consensus_score_intercell_source > 4) %>%
  dplyr::select(
    target_genesymbol,
    source_genesymbol,
    is_stimulation,
    consensus_score_intercell_source
  ) %>%
  unique
head(omni)
## # A tibble: 6 x 4
##   target_genesymbol source_genesymbol is_stimulation consensus_score_intercell_…
##   <chr>             <chr>                      <int>                       <int>
## 1 NRXN1             NLGN3                          0                           5
## 2 NRXN2             NLGN3                          1                           5
## 3 NRXN3             NLGN3                          1                           5
## 4 NRXN1             NLGN3                          1                           5
## 5 MUSK              AGRN                           1                           5
## 6 LRP4              AGRN                           0                           5
Suppose we have a few genes of interest:
my_genes <- c(
  "CD274", "CXCL1", "CXCL13", "CXCR3", "CXCR5"
)
Are the genes in this table?
Yes, and it looks like CXCR3 and CXCR5 are labeled as “target” genes:
my_genes[my_genes %in% omni$target_genesymbol]
## [1] "CXCR3" "CXCR5"
While CD274, CXCL1, CXCL13 are labeld as “source” genes:
my_genes[my_genes %in% omni$source_genesymbol]
## [1] "CD274" "CXCL1" "CXCL13"
Learn more #
Please see the OmniPath website for more details: https://omnipathdb.org/
There is a lot to explore: