Kirkham et al. 2006 is a prospective 2-year study of 60 patients with rheumatoid arthritis (RA). It shows that “synovial membrane cytokine mRNA expression is predictive of joint damage progression in RA”. The PDF includes a few tables with data on cytokine measurements and correlations with joint damage. Here, we’ll use Tabula to extract data from tables in the PDF file. Then we’ll make figures with R.
🐎 Tabula in action #
Download Tabula #
Go to tabula.technology and download the version for your operating system.
Mark each table with your mouse #
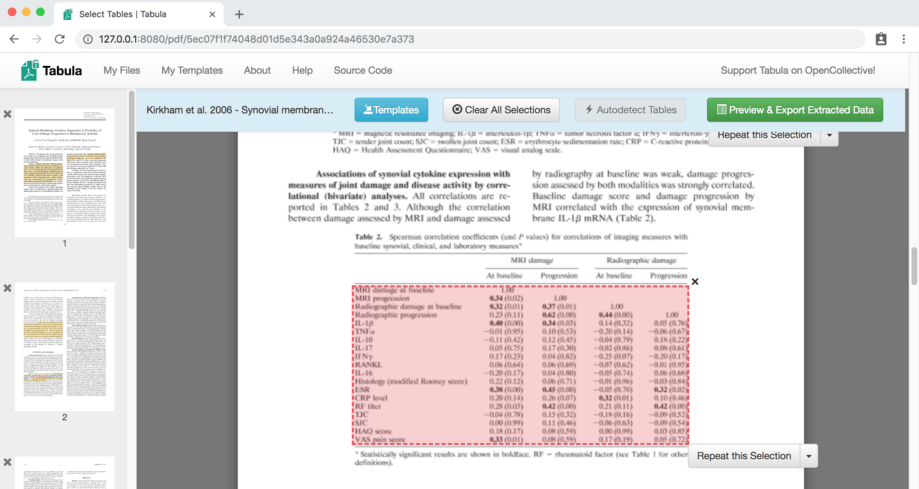
When you launch Tabula, you will see a new web site hosted at 127.0.0.1:8080.
Open a PDF file to get started. With your mouse, click and drag to make a
selection over each table in the PDF file. Don’t include extra things like
headers or notes below the table, because they usually won’t be recognized
correctly.
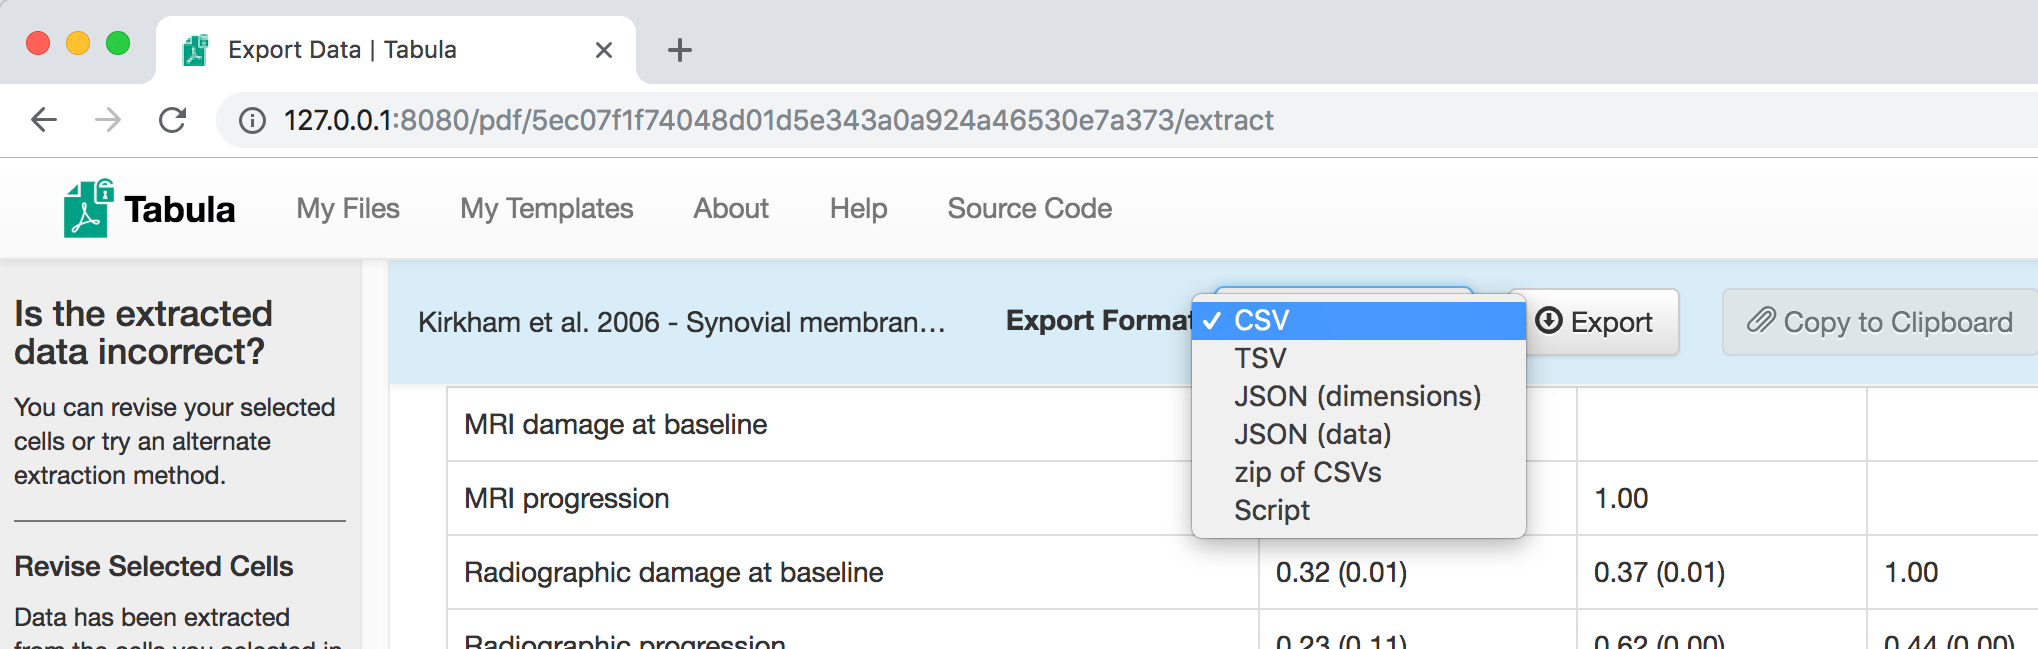
Export the data as a CSV or script #
You can export the data as a comma-separated-values (CSV) file, tab-separated-values (TSV) file, JSON, a zip file with multiple CSV files, or even as a shell script you can run from the command line.
For example, here is the shell script that I got by selecting Script as the
export format:
java -jar tabula-java.jar -a 118.958,100.598,327.803,510.638 -p 4 "$1"
With this script, we don’t need to launch the Tabula app. We can run the jar
file from the command line, giving the coordinates of the table with -a and
the page number with -p. The "$1" argument represents the name of the PDF
file.
See tabula-java for more details about the Java command line application.
💾 Download the data and code #
We can use RStudio to clean up the exported data with Find and Replace. Then, we can use R and ggplot2 to visualize the data.
Download the code for the figures here:
Here is the data, cleaned up and ready for making figures:
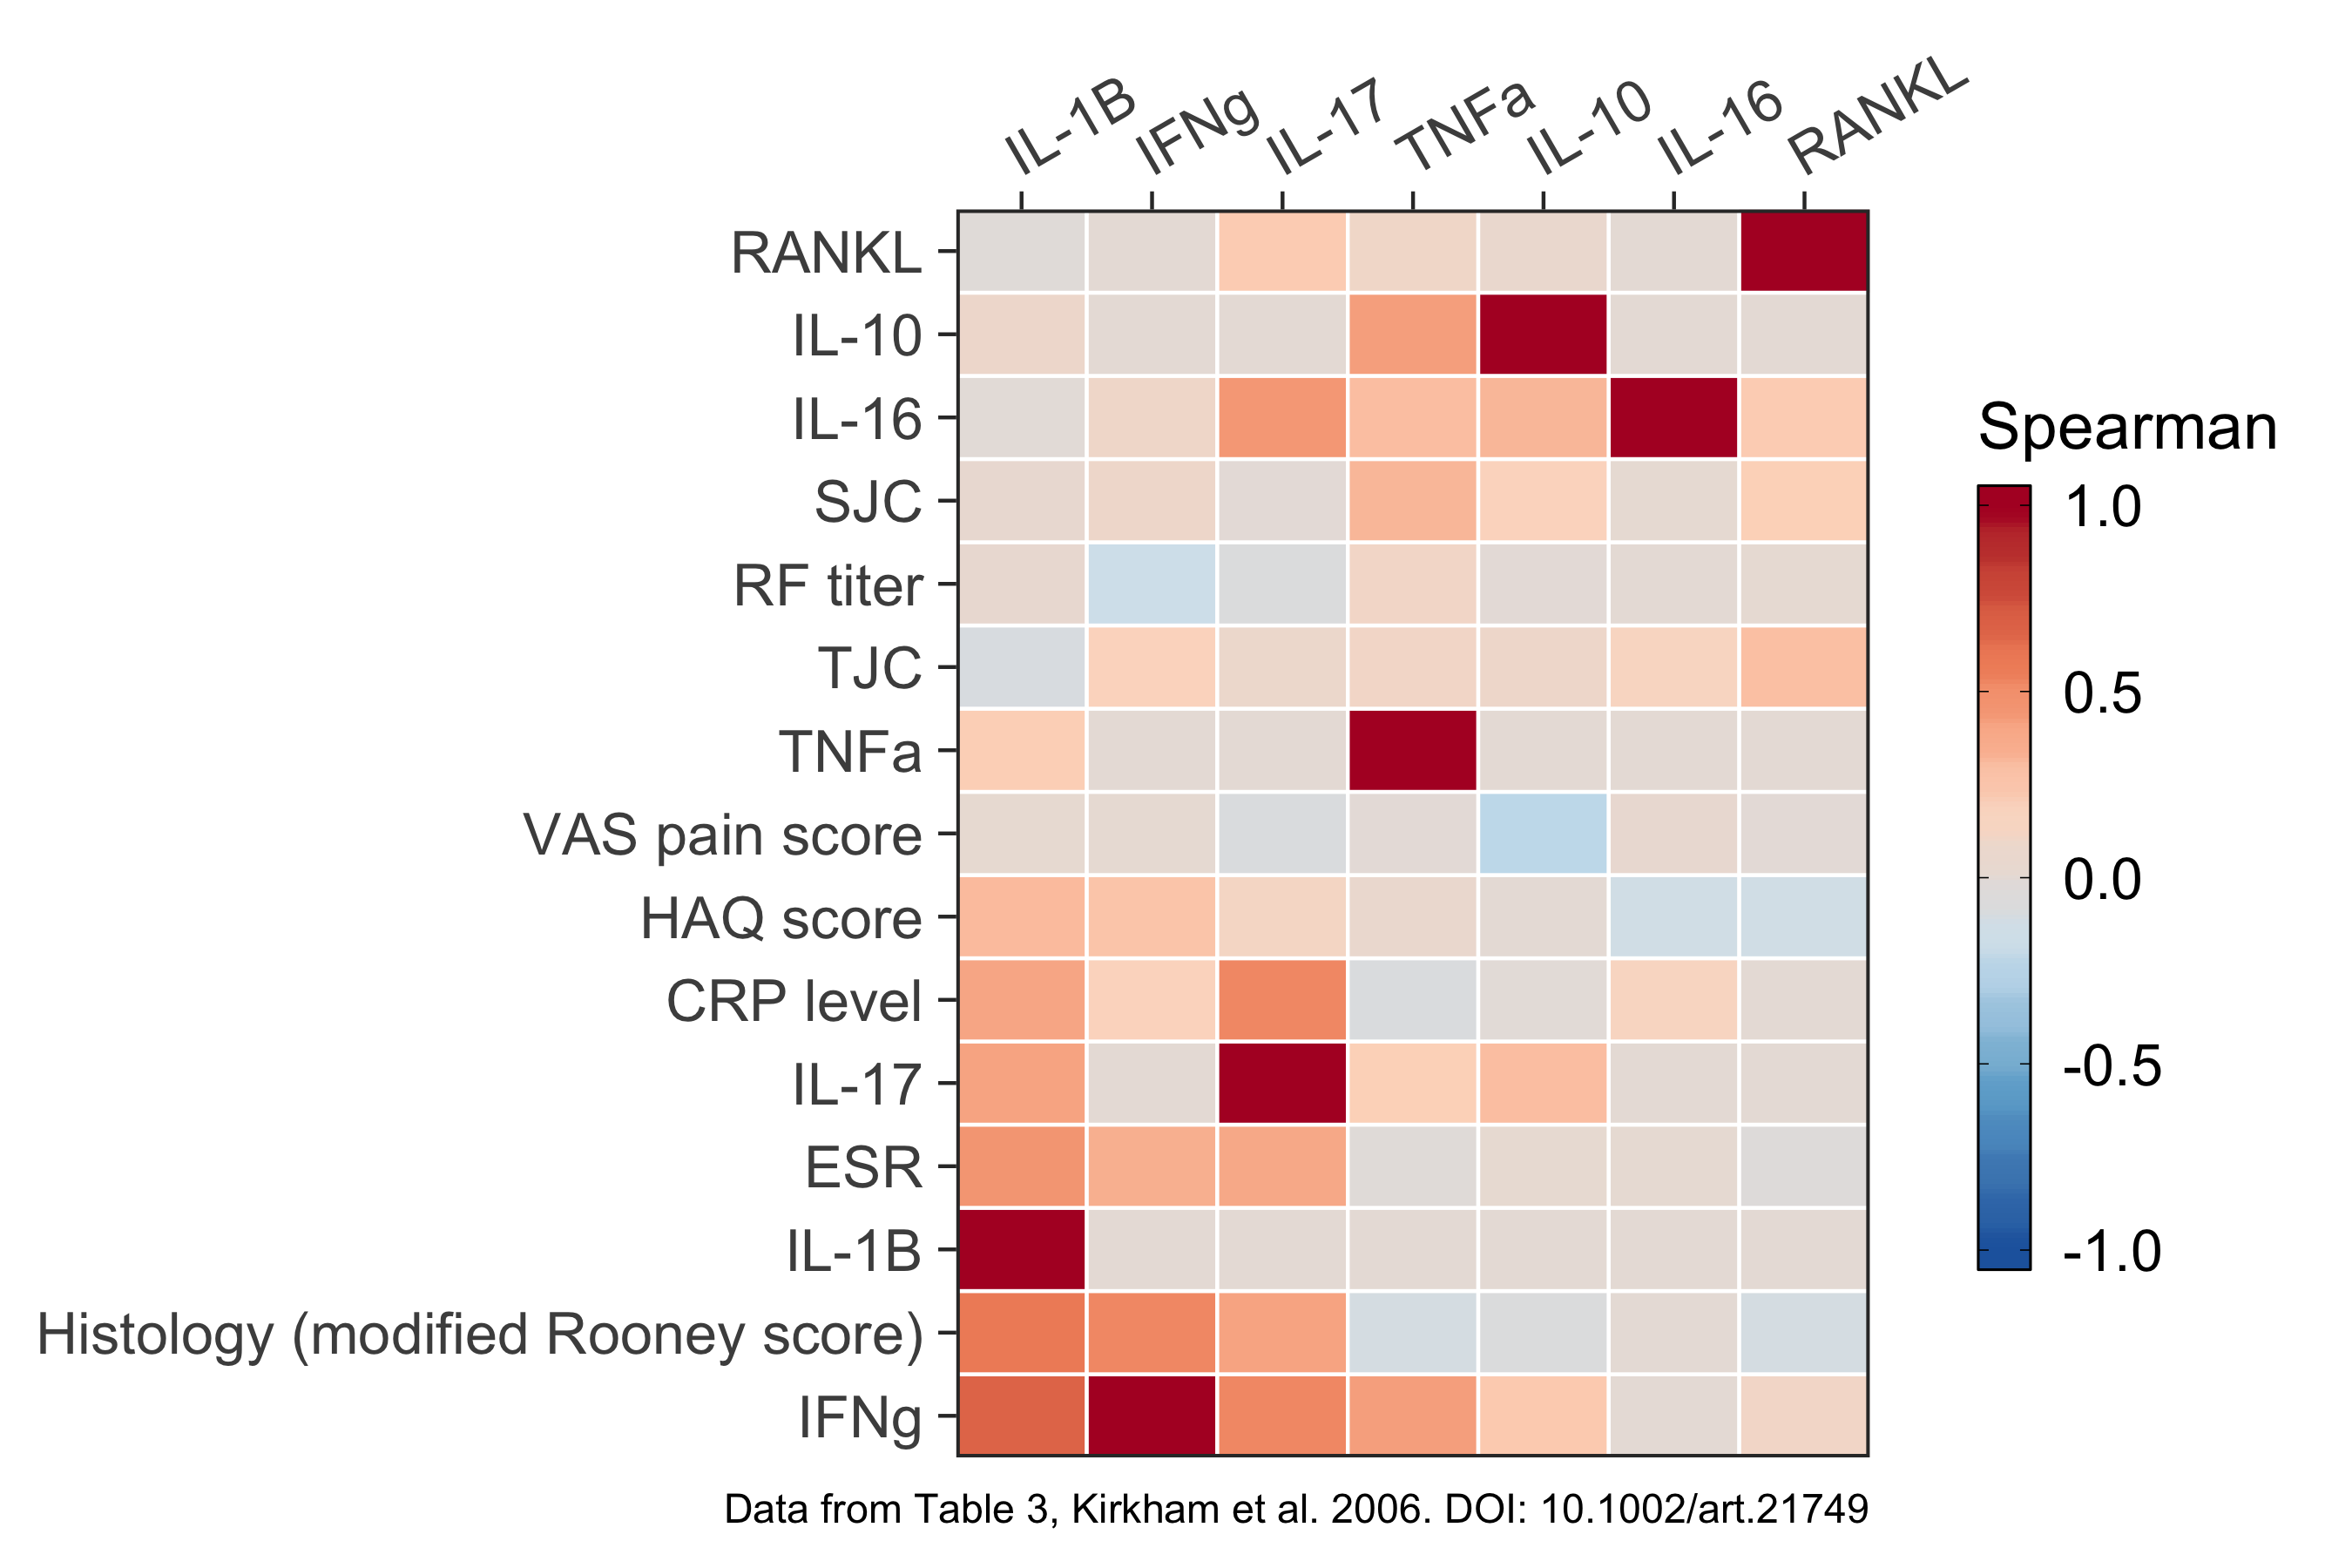
Below, you can see the figures I created for Tables 1, 2, and 3.
Figures #
Figure for Table 1 #
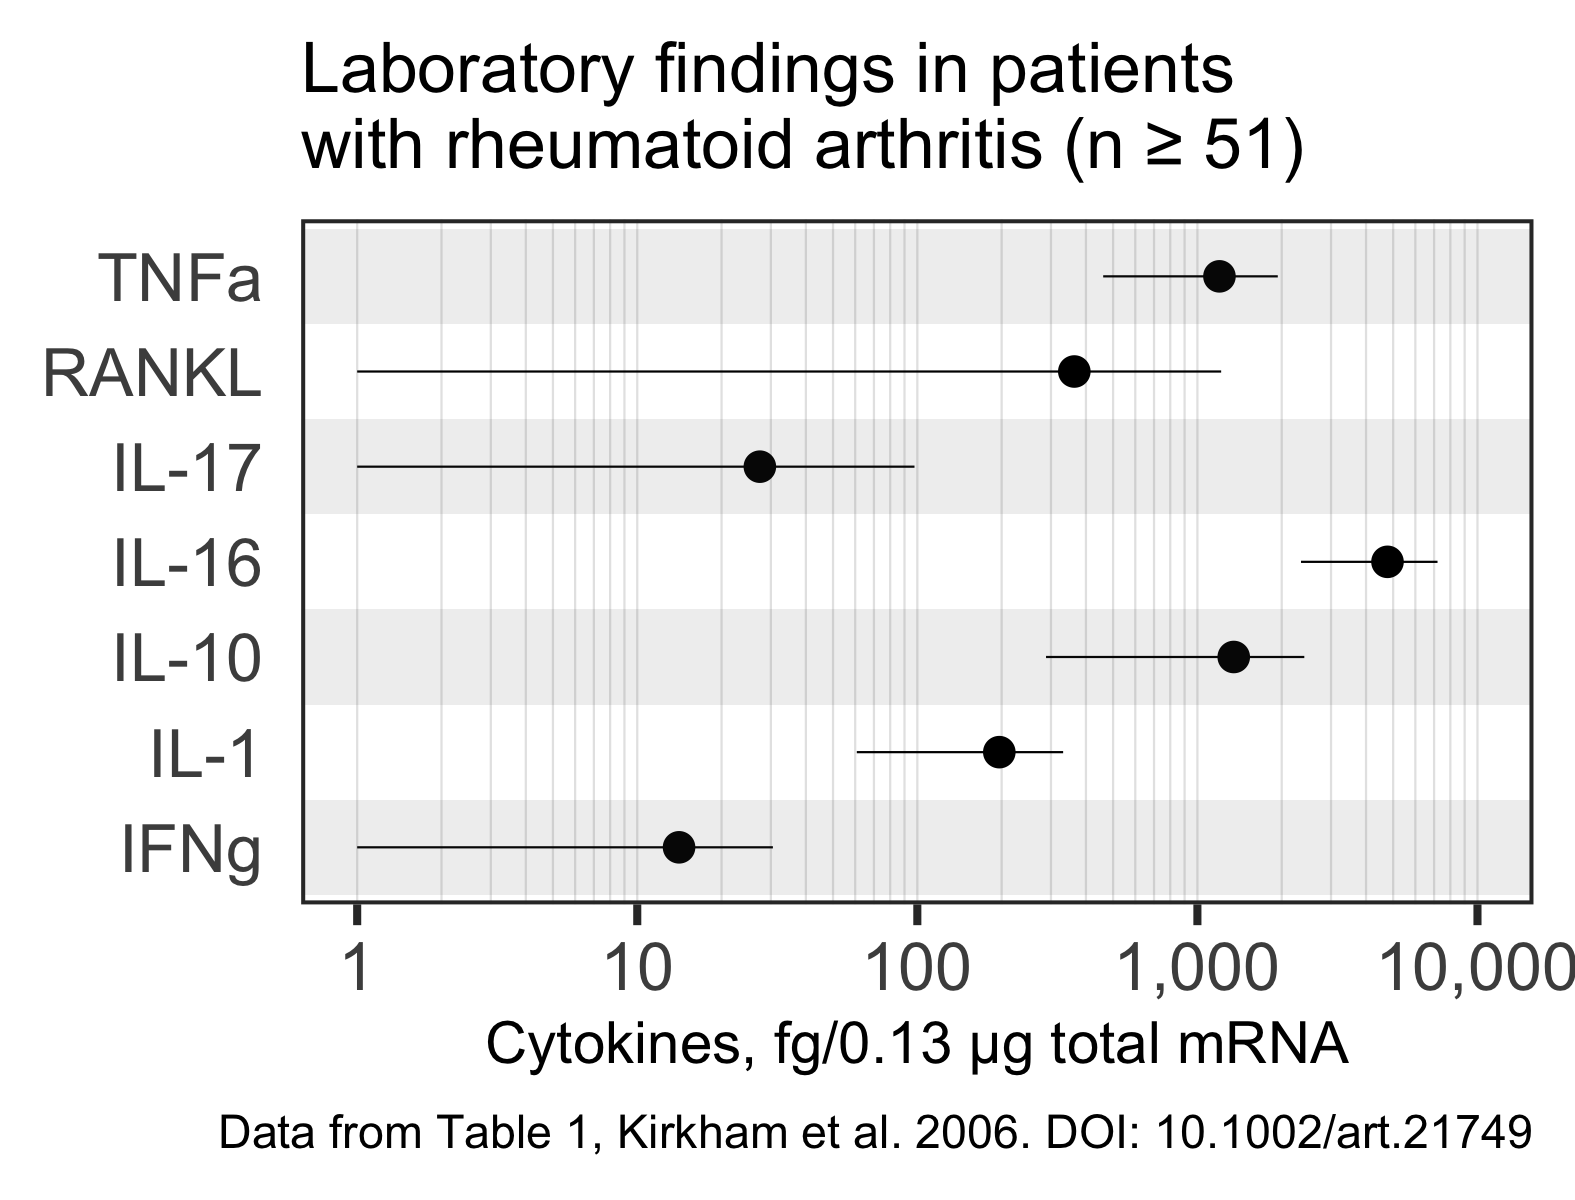
Figure for Table 2 #
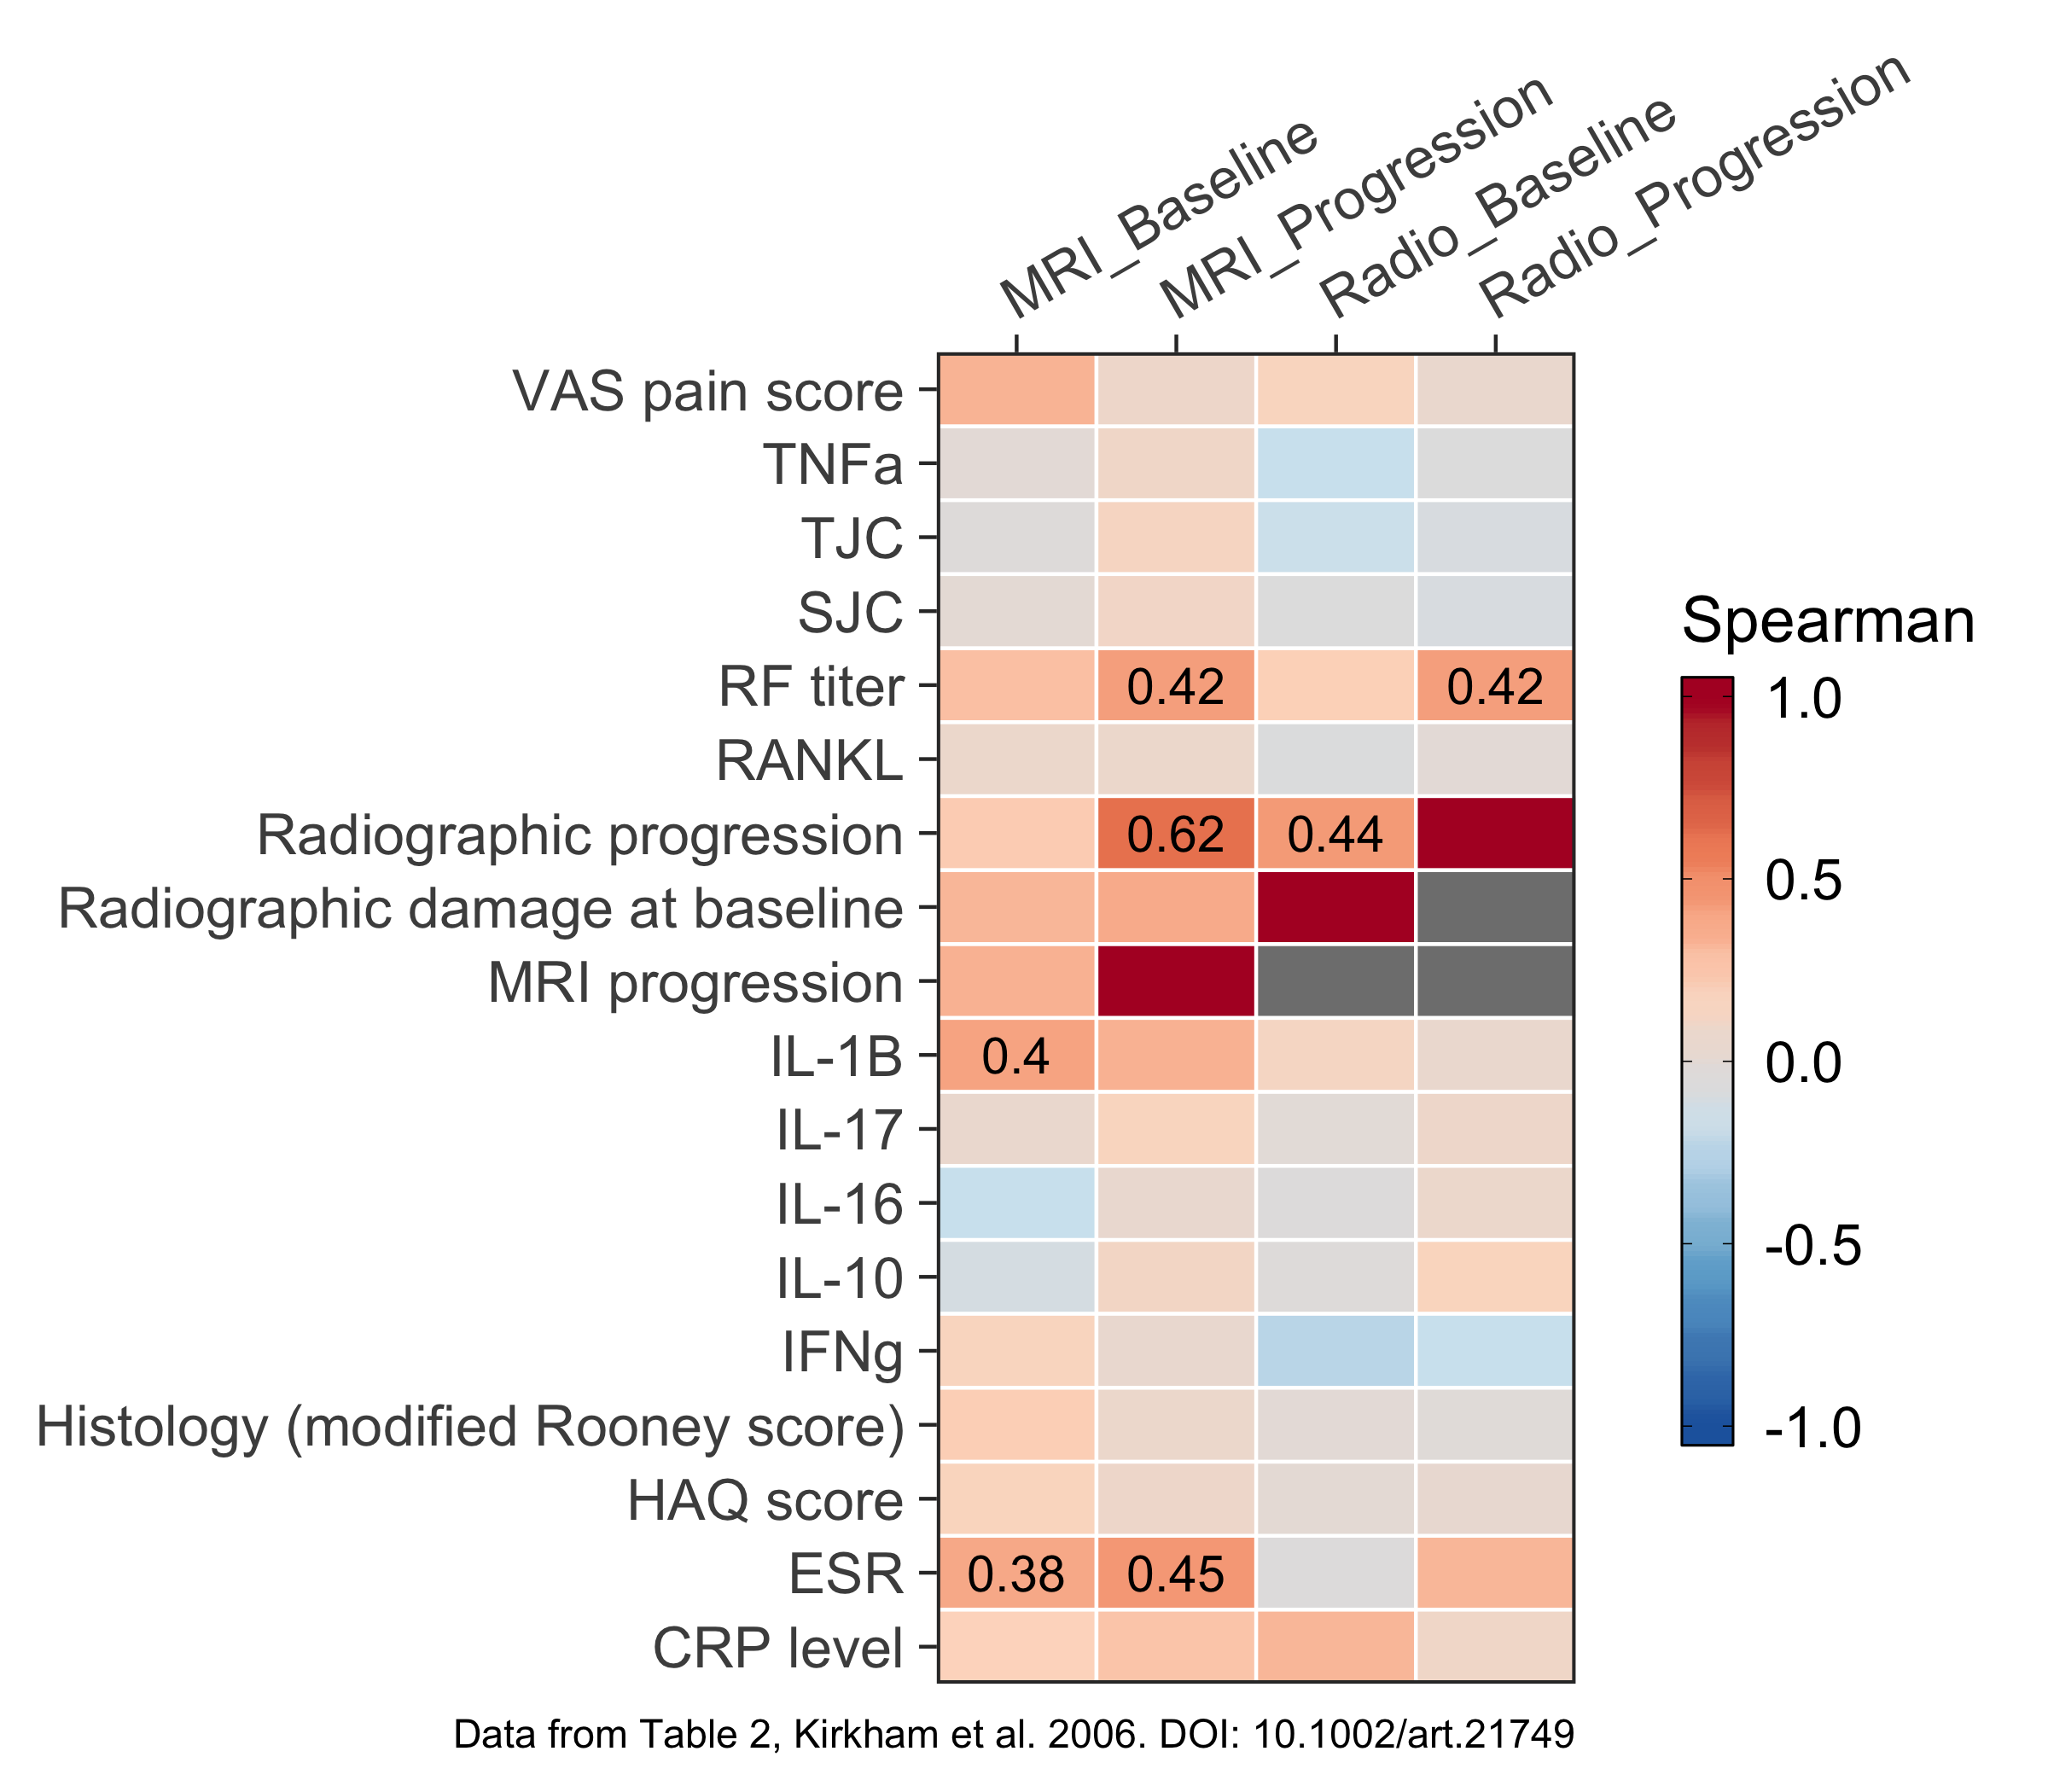
Figure for Table 3 #